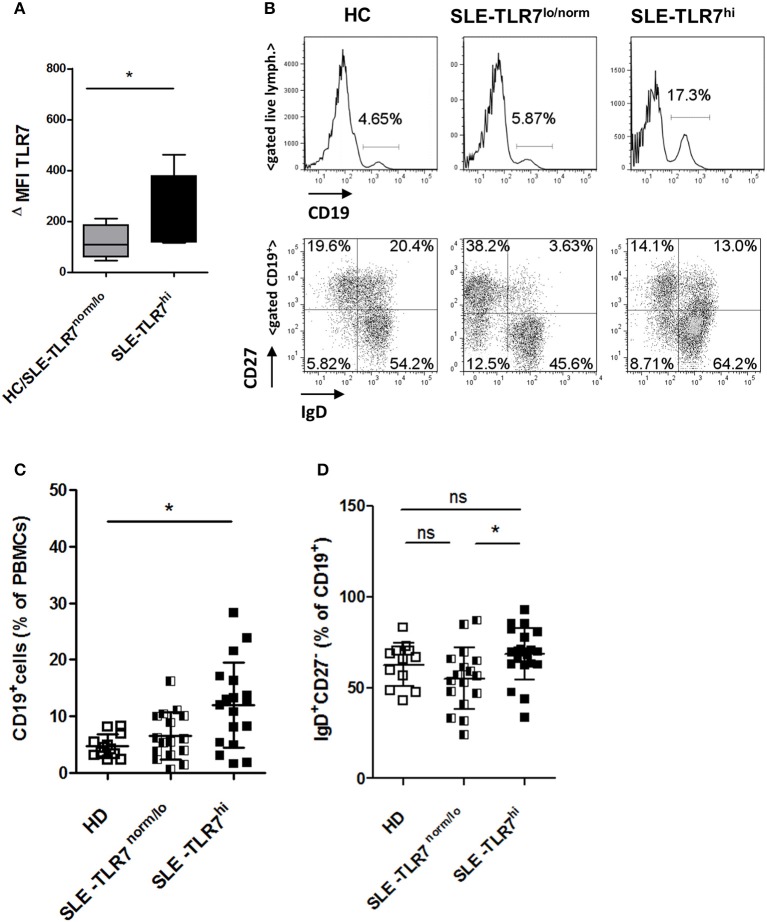
Figure 2.
Changes in peripheral B cells associated with high TLR7 expression (A) The expression of TLR7 in B cells analyzed by intracellular flow cytometry; graph shows normalized MFI of TLR7 protein expression in gated CD19+ B cells in HC/TLR7norm/lo SLE group (n = 4) compared to TLR7hi SLE group (n = 4); ΔMFI = MFI (anti-TLR7-PE signal)—MFI (Isotype-Ab-PE signal). Data are presented as mean ΔMFI ± SD, *p < 0.05 by Mann-Whitney test (B) Peripheral blood mononuclear cells (PBMC) from SLE patients and HCs were analyzed by flow cytometry. Representative flow cytometry plots of HC, TLR7norm/lo SLE and TLR7hi SLE groups, showing the frequency of CD19+ B cells of total PBMCs or gated CD19+ B cells stained with anti-CD27 and anti-IgD Abs, separating cells into IgD+CD27− (naïve), IgD−CD27+ (switched memory), IgD+CD27+ (un-switched memory), and IgD−CD27− (double-negative memory) subpopulations. Summary data of the frequencies of CD19+ cells in HC (n = 12), TLR7norm/lo (n = 16) and TLR7hi (n = 18) SLE groups (C) and the frequencies of IgD+CD27− (naïve) B cells (D). Differences between groups determined by Kruskal-Wallis, Dunn's post-test. Data are shown as the mean ± SD. *p < 0.05. (Additional data from the analysis of different B cell populations are presented in Supplemental Figure 2).

