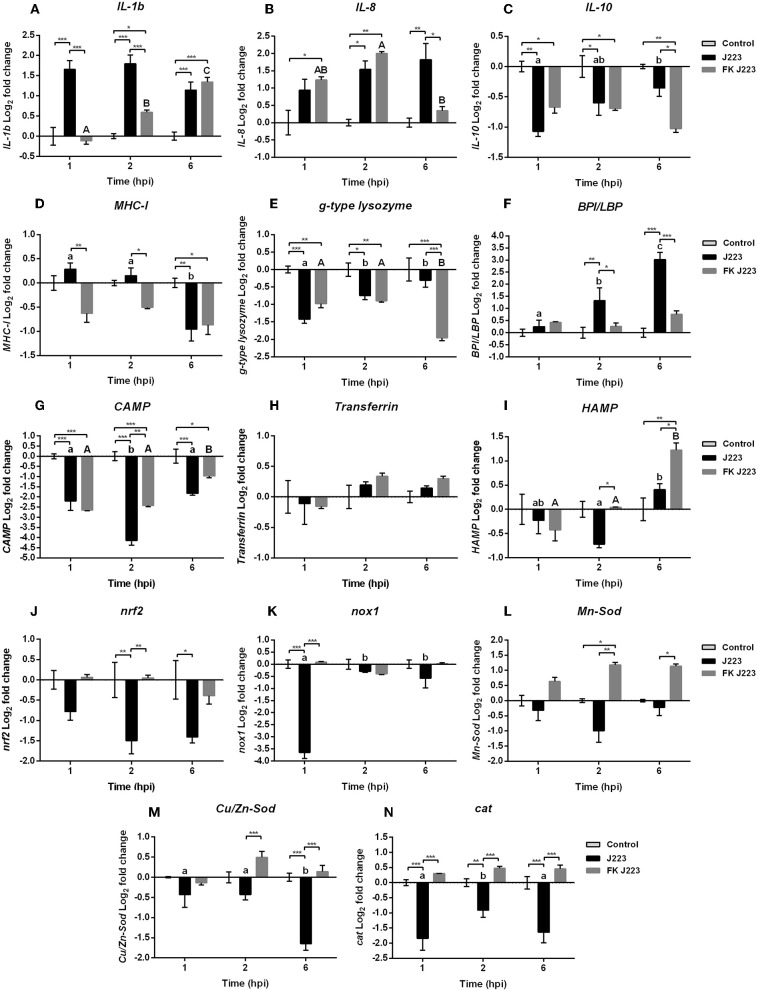
Figure 2.
Gene expression of (A) Interleukin 1b (IL-1b), (B) Interleukin 8 (IL-8), (C) Interleukin 10 (IL-10), (D) Major histocompatibility complex class 1 (MHC-I), (E) Goose type lysozyme (g-type lysozyme), (F) Bactericidal permeability increasing protein / lipopolysaccharide-binding protein (BPL/LBP), (G) Cathelicidin (CAMP), (H) Transferrin, (I) Hepcidin (HAMP), (J) Nuclear factor erythroid 2-related factor 2 (nrf2), (K) NADPH oxidase 1 (nox1), (L) Mn superoxide dismutase (Mn-Sod), (M) CuZn superoxide dismutase (Cu/Zn-Sod), and (N) Catalase (cat) in Atlantic cod primary macrophages isolated from head kidney and infected with live (J223) and formalin-killed A. salmonicida (FK 223) at different times post infection (1, 2, and 6 h). Relative expression was calculated using the 2(−ΔΔCt) method and Log2 converted using EF-1a as internal reference gene. Different letters represent significant differences between primary macrophages infected with J223 strain (lower case) or inoculated with FK J223 (upper case) at different times-points. Asterisks (*) represent significant differences between treatments on each time-point (*p < 0.05, **p < 0.01, ***p < 0.001). Each value is the mean ± S.E.M (n = 6).

