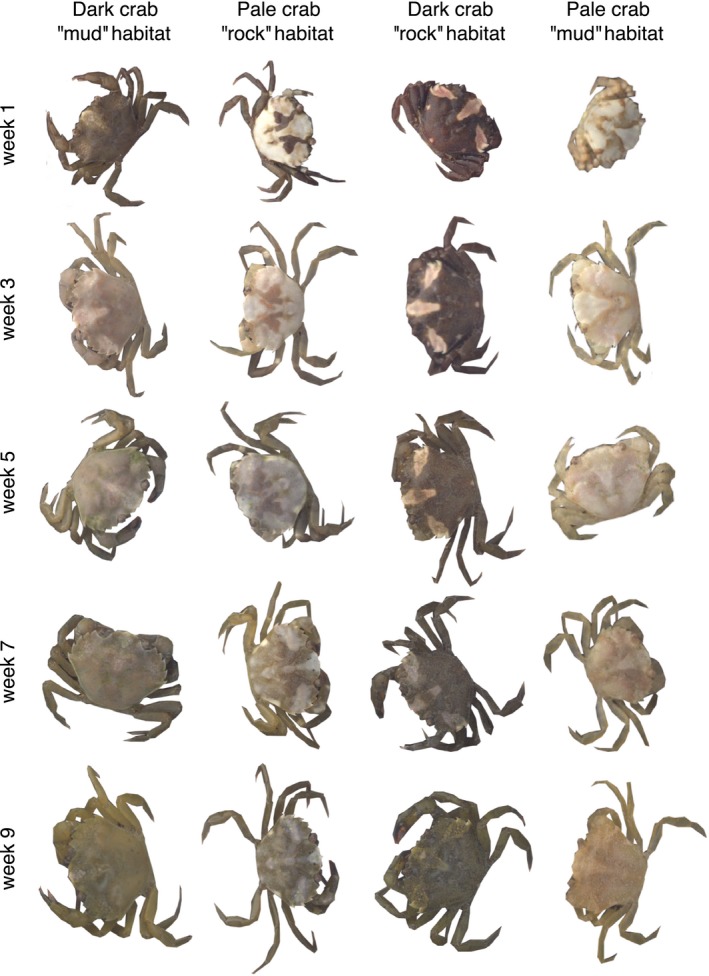
Figure 2.

Ontogenetic changes in the green shore crab (Carcinus maenas). The figure illustrates that crabs converge on a similar phenotypic domain as a function of time. The crabs in columns are examples of individual crabs reared on different treatments, with the starting point at the top and end at the bottom. First column is a dark crab on mud background, second is a pale crab on rock background, third is a dark crab on rock background, and fourth is a pale crab on mud background. The rows show phenotypic change over time, here shown at start and then every second week. Figure is not to scale
