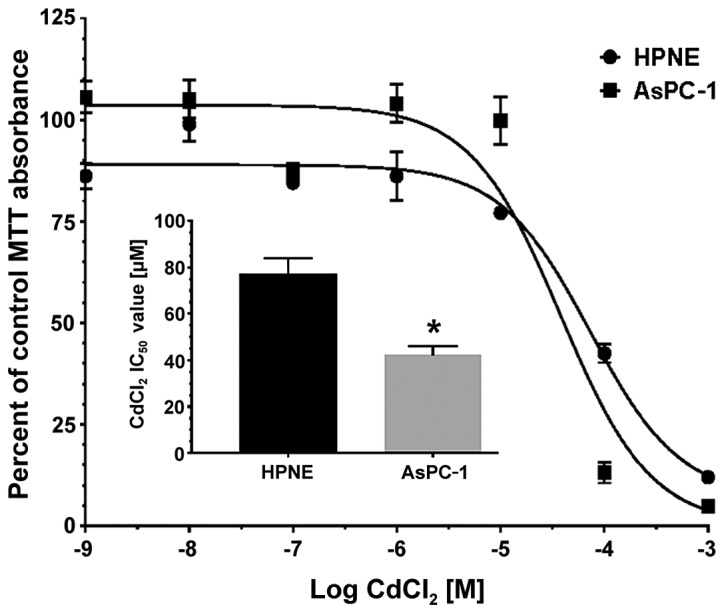
Figure 2.

Determination of LC50 values for CdCl2 in HPNE and AsPC-1 cells. Cells were plated in clear 96-well plate at approximately 10−5 cells/ml and allowed to adhere for 24 h. before the addition of assay media containing CdCl2 (1 to 1 mM). Cells were returned to the incubator for 48 h. MTT assay was performed as described in the Materials and methods and the data were best fit to a single-site model using nonlinear iterative curve fitting (GraphPad Prism). Individual LC50 values were calculated for each curve (inset) and AsPC-1 cells exhibited a lower LC50 value compared to HPNE LC50 values (P<0.01). Data are expressed as the means ± SEM of 6 assays performed in duplicate (n=6). *P<0.01 compared to the HPNE LC50 value. LC50, lethal concentration 50%; CdCl2, cadmium chloride.
