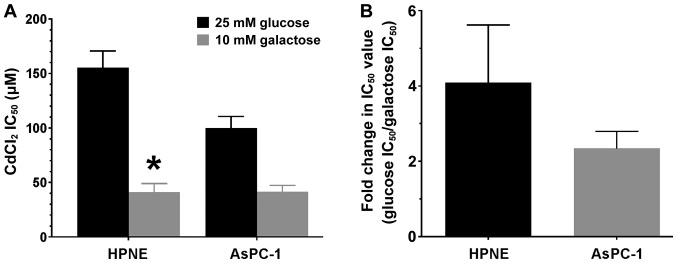
Figure 5.
Comparison of CdCl2 IC50 values in HPNE and AsPC-1 cells following 4 h of exposure to CdCl2. Media contained either 25 mM glucose or 10 mM galactose. Individual IC50 values were obtained from the data in Fig. 4 by analyzing each curve independently and then grouped by cell type. IC50 values (A) are expressed as μM and the rightward fold-shift in mean IC50 values (B) are expressed as the means ± SEM of 12 assays (n=12) performed in duplicate. CdCl2, cadmium chloride. *P<0.01 compared to HPNE IC50 value with 25 mM glucose.

