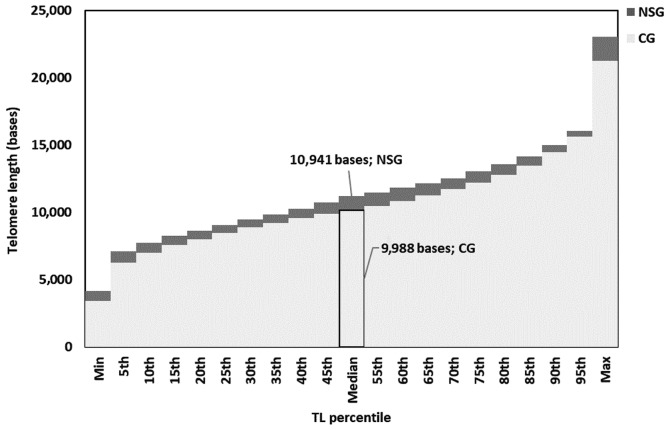
Figure 3.
Stacked bar chart of grouped median telomere lengths (in bases) of the control group (CG; light grey) and nutraceutical supplements group (NSG; dark grey). Each bar corresponds to a 5% increment in the grouped median telomere length. NSG group values tended to be higher in all studied percentiles than the CG group. TL, telomere length.

