
Figure 1.
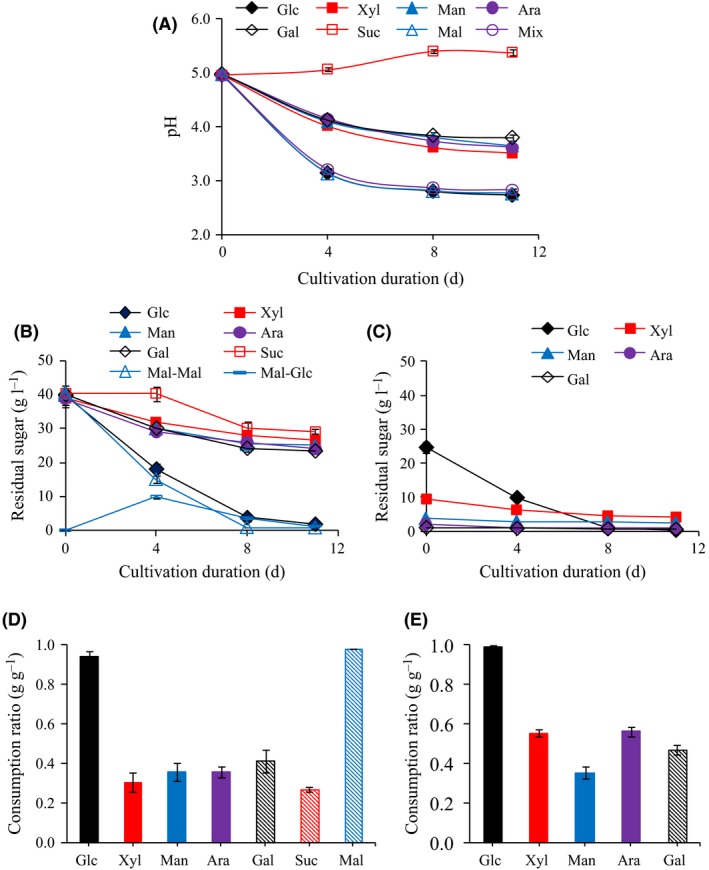
Time‐course of pH (A), sugar concentrations (B and C) and sugar consumption ratios (D and E) for cultures with eight different carbon sources. C and E show residual sugar concentrations and sugar consumption ratios in medium with a sugar mixture. Maltose would be partially hydrolysed to glucose, and therefore, the concentrations of maltose and glucose in the media are shown as Mal‐Mal and Mal‐Glc (B).