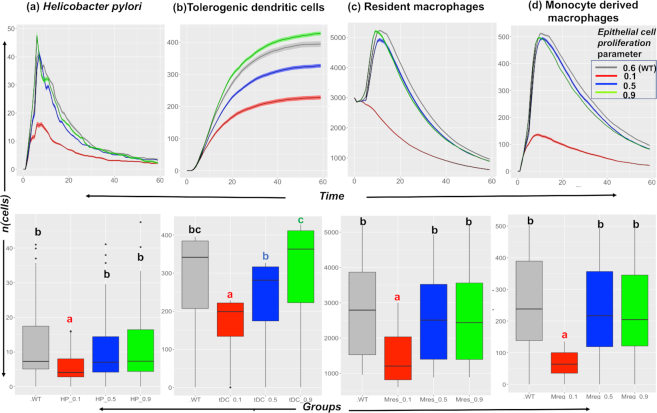
Figure 6:
In silico study of the effect of the epithelial cell proliferation parameter on the cell populations. The plots show the effect of varying the epithelial cell proliferation (p_Epiprolifer) parameter (with values 0.1, 0.5, 0.6 [WT], and 0.9) on the output cell population of (a) H. pylori, (b) tolerogenic dendritic cells, (c) resident macrophages, and (d) monocyte-derived macrophages. The parameter has a decreasing effect on the cellular populations under consideration, wherein a decrease in the parameter value decreases the abundance of the cells over time. The lower half of each panel shows the results for statistical comparison between the groups using ANOVA with the post hoc analysis. The letters “a,” “b,” “c,” and “bc” represent statistically significant differences (P < 0.05) between the groups obtained after running Tukey's honestly significant difference. The groups with letter "a" are statistically significantly different than groups with letter "b" and "c". The group with letter "bc" are statistically significantly different different than group "a" but they do not differ from groups "b" and "c". The groups with same letter are not statistically significantly different than each other.

