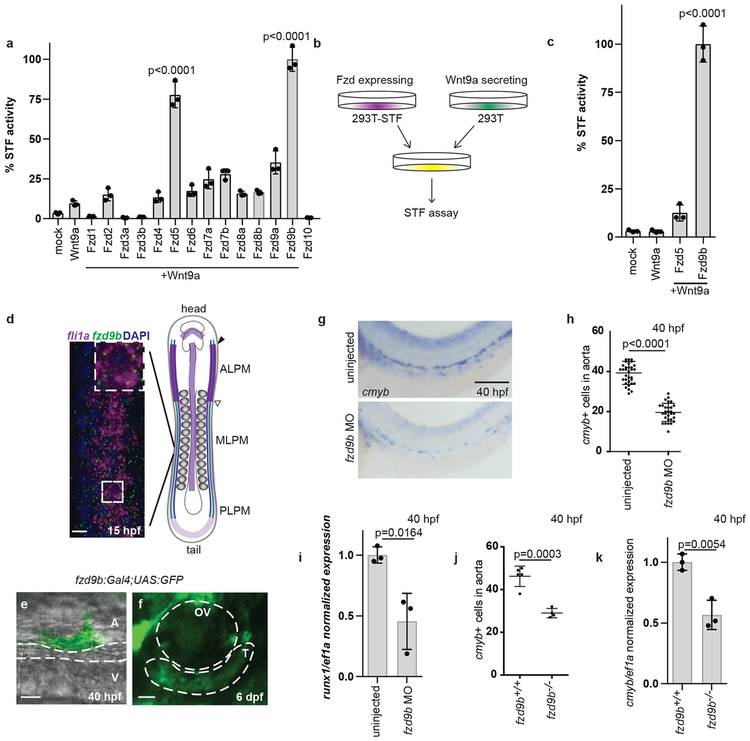
Figure 1: Fzd9b is required for zebrafish haematopoietic stem cell development.
a. STF assay screen with zWnt9a and zFzds, n=3 biological replicates for each. b. zWnt9a cells were mixed with zFzd9b or zFzd5 STF cells and assayed for Wnt activity, quantified in c (n=3 biological replicates for each). d. FISH for fzd9b and fli1a in 16 hpf zebrafish embryos. MLPM-medial lateral plate mesoderm PLPM- posterior lateral plate mesoderm, ALPM- anterior lateral plate mesoderm. Scale bar=10um. Diagram shows haematopoietic precursors (green), vascular precursors (blue) and fzd9b (purple). e. Cell emerging from the aorta labeled by fzd9b:Gal4; UAS:GFP at 40 hpf. Scale bar=10um. A- aorta, V-vein. f. Thymus cells labeled by fzd9b:Gal4; UAS:GFP at 6 dpf. T-thymus, OV- otic vesicle; scale bar=25um. g. WISH for cmyb at 40 hpf in fzd9b morphants and controls. Scale bar=30um, quantified in h. Each dot represents a biological replicate; n=32 control, n=30 MO. In d-g, images are representative of 10 embryos examined in 3 independent experiments. i. qPCR for cmyb (black) and runx1 (white) in fzd9b morphants (n=3) and controls (n=3) at 40 hpf. j. Quantification of WISH for cmyb at 40 hpf in fzd9b mutants (n=4) and controls (n=5). Each dot represents a biological replicate. k. qPCR for cmyb in fzd9b mutants (n=3) and controls (n=3) at 40 hpf. In all graphs, dots represent biological replicates from a single experiment, bars represent the mean and error bars represent the standard deviation. All STF assays were repeated independently with a similar trend. All qPCR data was generated from biological replicates from dissected trunks and tails each represented as a dot. n.s. not significant. Statistical analyses by ANOVA compared to controls as indicated.

