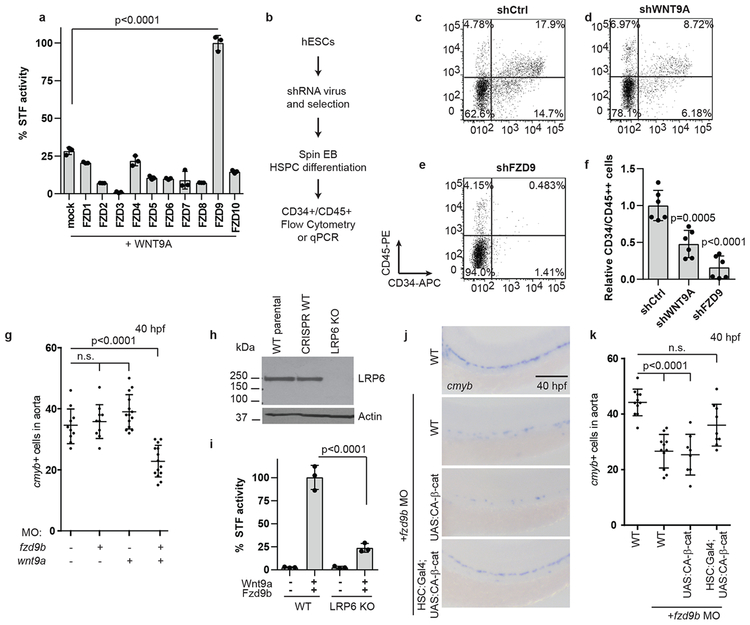
Figure 2: Fzd9b interacts genetically with Wnt9a.
a. Quantification of STF assay screen with human WNT9A and FZDs; n=3 biological replicates each. b. Schematic of experimental design for HSPC derivation. Representative flow cytometry plots of CD34 vs CD45 cells after 14 days of differentiation towards HSPCs in shControl (c), shWNT9A (d) and shFZD9 (e) transduced cells. Note the loss of double positive cells with the loss of WNT9A or FZD9, quantified in f, n=6 biological replicates each. g. Quantification of WISH for cmyb in suboptimal MO (0.1ng wnt9a, 0.5ng fzd9b) treated zebrafish at 40 hpf; n=10, 10, 14, 14 biological replicates from left to right. h. LRP6 immunoblot of lysates from WT HEK293T STF cells (WT parental), CRISPR-treated cells without disruption of LRP6 (CRISPR WT), and LRP6 null mutant line (LRP6 KO). Image representative of 4 experimental replicates. i. STF activity in WT and LRP6 KO HEK293T STF cells transfected with zWnt9a and zFzd9b. n=3 biological replicates for each. j. WISH for cmyb at 40 hpf in WT, UAS:CA-β-catenin and gata2b:Gal4;UAS:CA-β-catenin, injected with fzd9b MO. Scale bar=30um. k. Quantification of j; n=11, 11, 8 , 9 biological replicates from left to right. In all graphs, each dot represents a biological replicate from a single experiment, bars represent the mean, error bars represent the standard deviation. All STF assays were repeated independently with a similar trend. n.s. not significant. Statistical analyses by ANOVA compared to controls as indicated.

