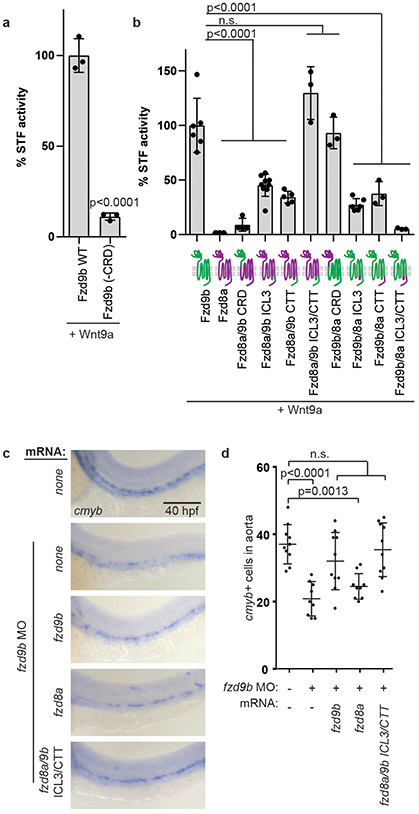
Figure 3: Wnt9a-Fzd9b specificity is mediated intracellularly.
a. STF assay with zWnt9a and zFzd9b with and without the cysteine rich domain (CRD); n=3 biological replicates each. b. STF assay with zWnt9a and zFzd9b/zFzd8a chimeras (schematics on x-axis; magenta=fzd8a; green=fzd9b); n=6, 3, 4, 9, 5, 3, 3, 6, 3, 3 biological replicates from left to right. c. WISH for cmyb at 40 hpf in fzd9b morphants injected with mRNAs for fzd9b, fzd8a and fzd8a with ICL3 and CTT from fzd9b and uninjected control. Scale bar=30um. d. Quantification of c; n=10, 9, 10, 9, 10 biological replicates from left to right. In all graphs, each dot represents a biological replicate; bars represent the mean and error bars represent the standard deviation. n.s. not significant. Panel b shows data from 2 experiments, while all other graphs represent biological replicates from the same experiment. All STF assays were repeated independently with a similar trend. Statistical analyses by ANOVA compared to controls as indicated.

