
Figure 3. Distinct Nucleic Acid and Lipid Composition of sEVs and DNPs.
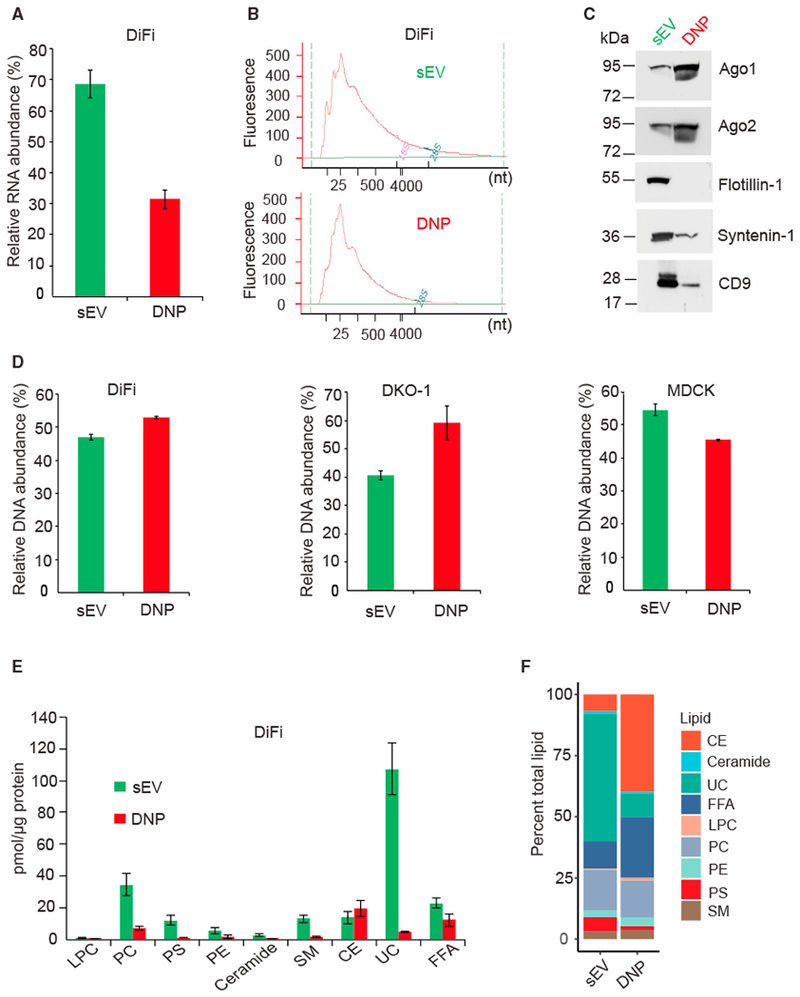
(A) Relative abundance of RNA isolated from DNPs and sEVs derived from DiFi cells. One biological experiment was performed in triplicate. Data are presented as mean ± SEM. RNA was isolated from equal amounts of total protein in sEVs and DNPs.
(B) Size distribution of RNA isolated as shown in (A).
(C) Immunoblot for Argonaute proteins and exosomal markers in DNPs and sEVs derived from DiFi cells. Equal amounts of proteins were loaded.
(D) Relative abundance of DNA isolated from DNPs and sEVs derived from cell lines indicated. Three independent biological experiments were performed for DKO-1 cells. For DiFi and MDCK parental cells, one biological experiment with three technical replicates was performed. Data are presented as mean ± SEM. DNA was isolated from equal amounts of total protein in sEVs and DNPs.
(E) Amount of each lipid class detected in DiFi cell-derived DNPs and sEVs. Lipidomic analysis was performed by ESI-MS. Two biological experiments were performed. Data are presented as mean ± SEM. Equal amounts of total protein in sEVs and DNPs were used for the analysis.
(F) Individual lipid molecular species were quantified by comparisons to the internal standards (see STAR Methods).LPC, lysophosphatidylcholine; PC, choline glycerophospholipid; PE, ethanolamine glycerophospholipid; PS, serine glycerophospholipid; CE, cholesteryl ester; SM, sphingomyelin; Cer, ceramide; UC, unesterified cholesterol; FFA, free fatty acid.
See also Figures S3 and S4.