
Figure 1.
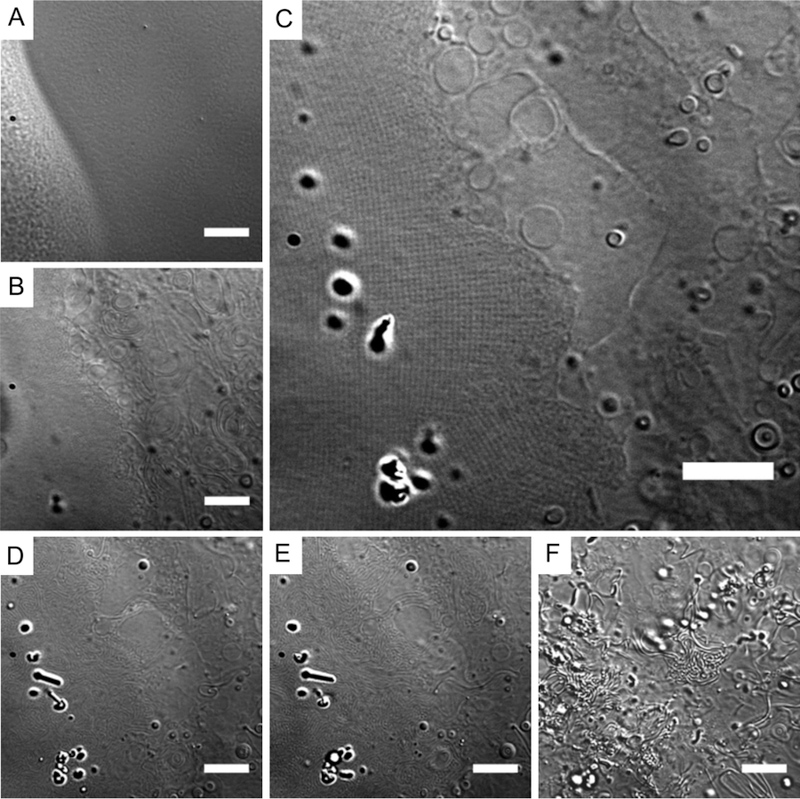
Hydrated 24-h oxidized DOPE lipid. (A) Dried lipid film. (B–F) Hydrated lipid film: (B) 20 s and (C) 4 min after addition of water, showing a lattice structure (left side) and the lamellar phase as vesicles and tubules (right side), followed by transition from the lattice structure into tubules (D) 7 min and (E) 8 min after hydration. (F) At 10 min after hydration, tubules lifted upward and therefore appeared at higher contrast. Scale bars = 10 μm.