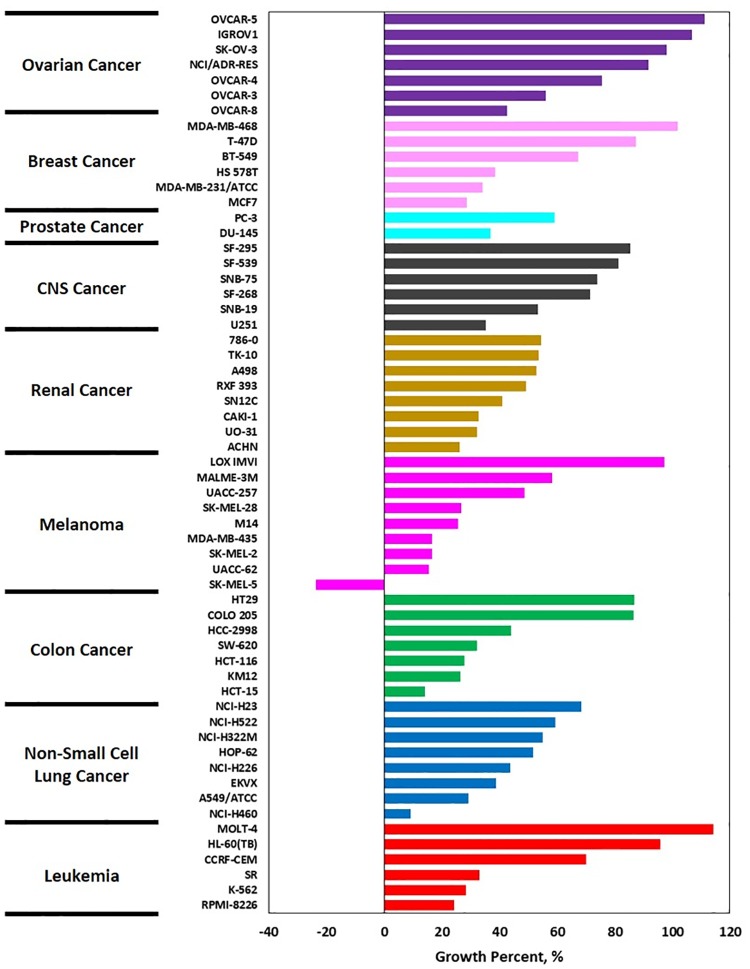
Fig 2. Waterfall plot of the growth percent of 59 cell lines in response to 10 μM of deacetylnemorone, determined by the NCI-60 one dose screening test.
Growth percent was defined from -100%, where no cells were detected to 100%, where the cells were treated with growth media alone. Growth percent of 0% represented no change in the number of cells after treatment. The tissue type of each cell line is denoted by color (Purple–Ovarian Cancer, Pale pink–Breast Cancer, Aqua–Prostate Cancer, Grey–CNS cancer, Gold–Renal Cancer, Bright Pink–Melanoma, Green–Colon Cancer, Blue–Non-small cell lung cancer, Red–Leukemia).

