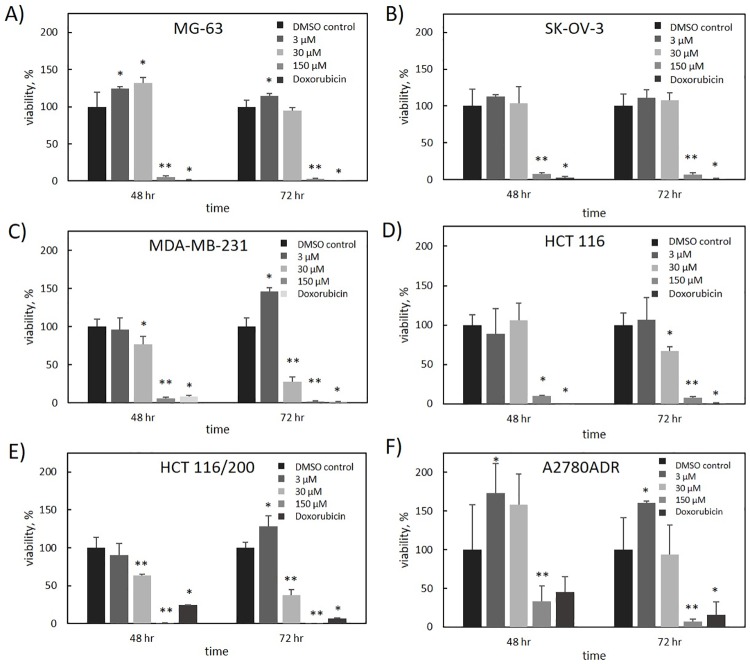
Fig 3. Percent viability of A) MG-63, B) SK-OV-3, C) MDA-MB-231, D) HCT 116, E) HCT 116/200, and F) A2780ADR cells in response to various concentrations of deacetylnemorone after 48 and 72 hours of exposure, as determined by the MTS cytotoxicity assay.
For all cell lines except A2780ADR, the concentration of doxorubicin was 2 μM. For the A2780ADR cell line the concentration of doxorubicin was 1 μM. P-values, determined for each experimental group using a two-tailed t-test compared to the control, are shown above the bar graphs. * denotes a significant difference (p < 0.05) from the control group. ** denotes a significant difference (p < 0.05) from the previous concentration in addition to the control group. P-values greater than 0.05 were omitted.

