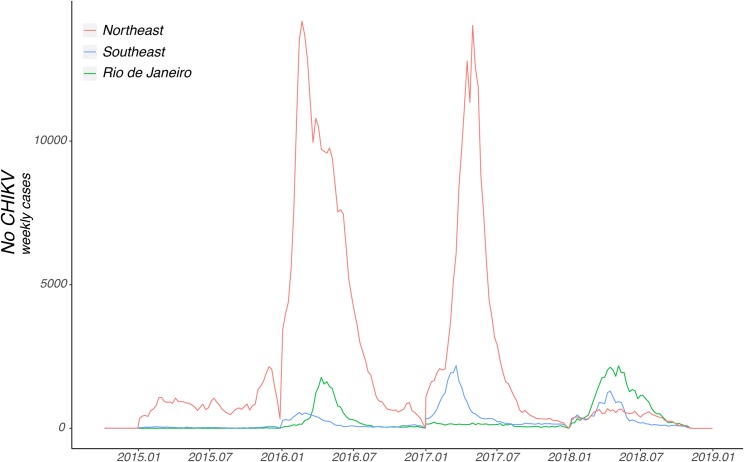
Fig 3. Weekly notified Chikungunya fever cases in the north-eastern and south-eastern regions of Brazil, 2015–2018.
Number of chikungunya fever cases by epidemiological week registered in the north-eastern and south-eastern regions of Brazil between 2015 and 2018. Epidemic curves are coloured according to geographical region (see legend). Number of cases from the state of Rio de Janeiro alone is represented by the green curve and it is not computed in the curve from southeast. Chart was generated by R software.

