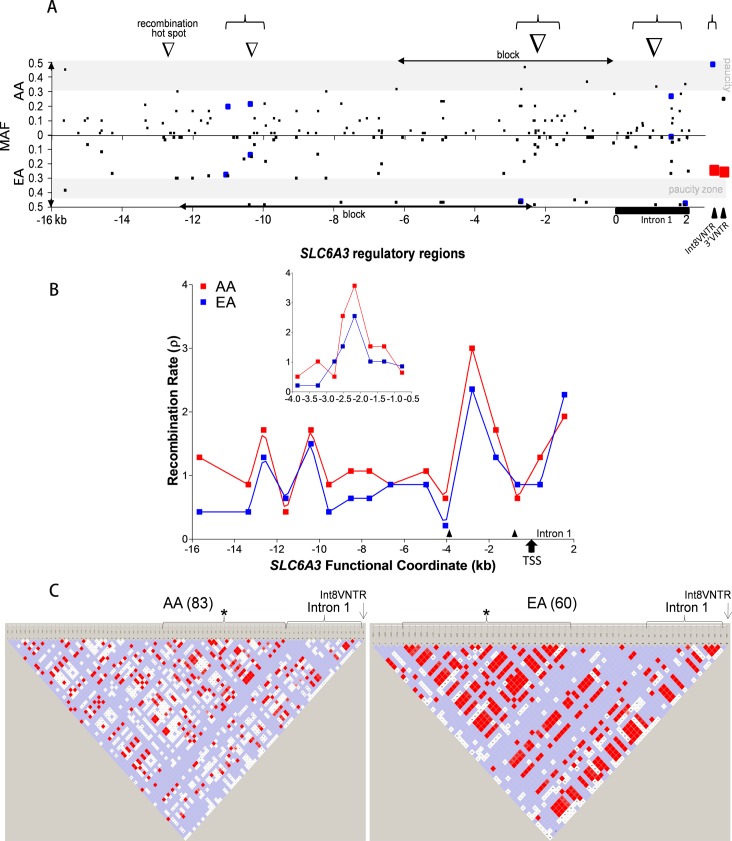
Fig 1. SLC6A3 regulatory region polymorphisms.
(A) Asymmetric distribution of common polymorphisms between the AA (upper panel) and the EA (lower panel) cohorts. Each polymorphism is indicated by small black square. Gray areas indicate paucity of polymorphisms for indicated MAF range. Black horizontal bar, location of Intron 1; black triangles, Int8VNTR and 3’VNTR; horizontal double-arrow, block; inverted open triangle, recombination hotspot for both populations; blue square, genetic selection; large red squares, SUDs-associated polymorphisms. Upper brace, clustering of selections. (B) Distribution of recombination rate across the 18 kb SLC6A3 promoter regions. Red, AA; blue, EA. Insert, a close-up for the region indicated by two arrow heads, by using a finer scale (see x axis). Arrow, transcription start site (TSS). (C) Haploview-based linkage disequilibrium (LD) in SLC6A3 regulatory regions (18 kb and Int8VNTR). Left, AA; right, EA. *, block; arrow, location of Int8VNTR. 3’VNTR was not included due to multiple alleles. Parenthesis contains the number of polymorphisms used for the LD analysis. Color: red for stronger LD; white, little LD. Brackets, haplotype blocks defined by Haploview.

