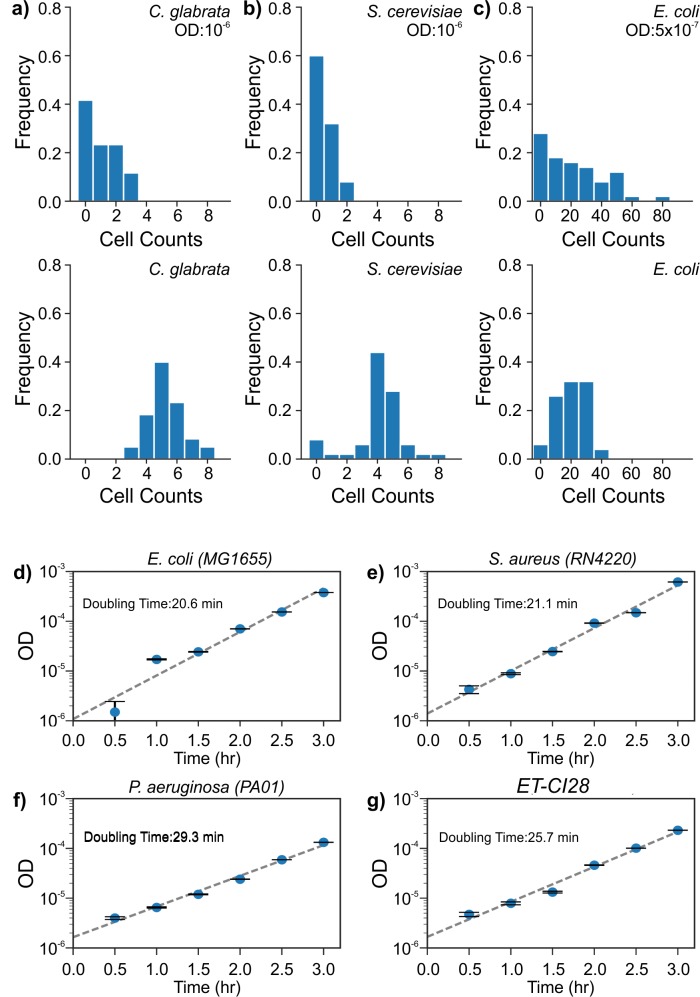
Fig 2. RUSD detects extremely low bacterial and fungal cell counts.
(a) Top panel: Counts for C. glabrata at approximately OD 10−6 displays a Poisson distribution with counts of 0, 1, 2, and 3 with a mean value of about 1. Bottom panel: Increasing the yeast cell density shifts distribution toward a normal distribution with a mean value of about 5.3 cells. (b) S. cerevisiae at an OD nearly 10−6 (top panel) results in a Poisson distribution with counts of 0, 1, and 2 and a mean value of approximately 0.48; (lower panel) a slight increase of cell density moves distribution toward a normal distribution with a mean value of approximately 4 cells. (c) Counts for E. coli culture at (top panel) an OD of approximately 5 × 10⁻⁷, yields about 25 cells; (lower panel) increasing the bacterial cell density slightly shifts distribution toward a normal distribution with a similar mean value of about 24 cells with smaller standard deviation, which shows the sensitivity limit of the device. ODs of bacterial cultures grown in LB (started from OD roughly 5 × 10⁻⁷) and recorded by RUSD: (d) E. coli (MG1655), (e) S. aureus (RN4220), (f) P. aeruginosa (PAO1), and (g) an E. coli clinical isolate (ET-CI28). (The data for Fig 2 can be found in S1 Data). LB, lysogeny broth; OD, optical density; RUSD, rapid ultrasensitive detector.

