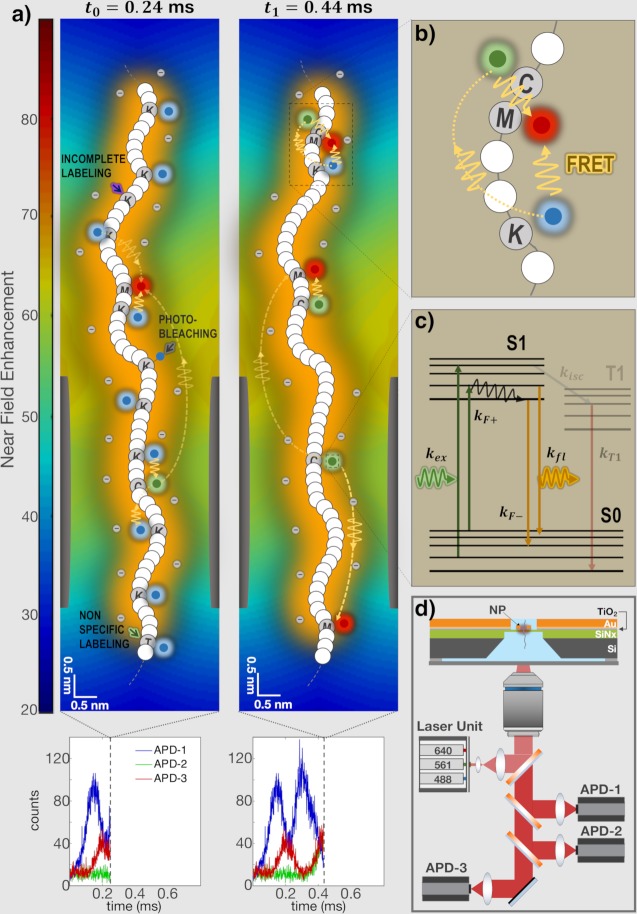
Fig 2. Simulation of the fluorescence signals generated during the translocation of the SDS-denatured PH and SEC7 domain-containing (PSD) protein.
(a) The nanopore diameter and height were set to 3 and 5 nm, respectively, and the plasmonic architecture deposited on its ‘top-side’ produced a confined excitation profile (14–20 nm axial full-width half maximum) whose color map displayed on the left indicates the excitation near field enhancement at a wavelength of 640 nm (modeled using FDTD, see S1 Note). Two snapshots of the translocation process are shown and denoted by the timepoints t0 and t1 at which they were respectively taken. Energy transfer, photo-bleaching, incomplete labeling and non-specific labeling are indicated by dotted yellow lines, solid grey, purple and green arrows, respectively. (b) Zoomed in region of the polypeptide in which Forster resonance energy transfer (FRET) is shown in greater details. In this configuration, energy was transferred from lysine fluorophores to cysteine and methionine emitters, and from cysteine to methionine fluorophores. (c) The fluorescence emission rate of each labeled amino-acid was modeled as either a two-state or three-state system (see online methods for further details and in which kF+ and kF- refer to kFRET,+ and kFRET,-, respectively). kexc denotes the absorption rate, kisc the inter-system crossing rate and kT1 the triplet state relaxation rate. Fluorophores are depicted in a color which denote the excitation wavelength with which they are excited or the channel to which they belong. (d) Schematics of the nanopore chip and optical system, which includes a high NA water immersion objective lens, three excitation laser lines and corresponding APDs. The nanopore chip is made of four consecutive layers: silicon (grey), silicon nitride (green) in which the nanopore is drilled, titanium oxide (grey blue) and gold (orange).

