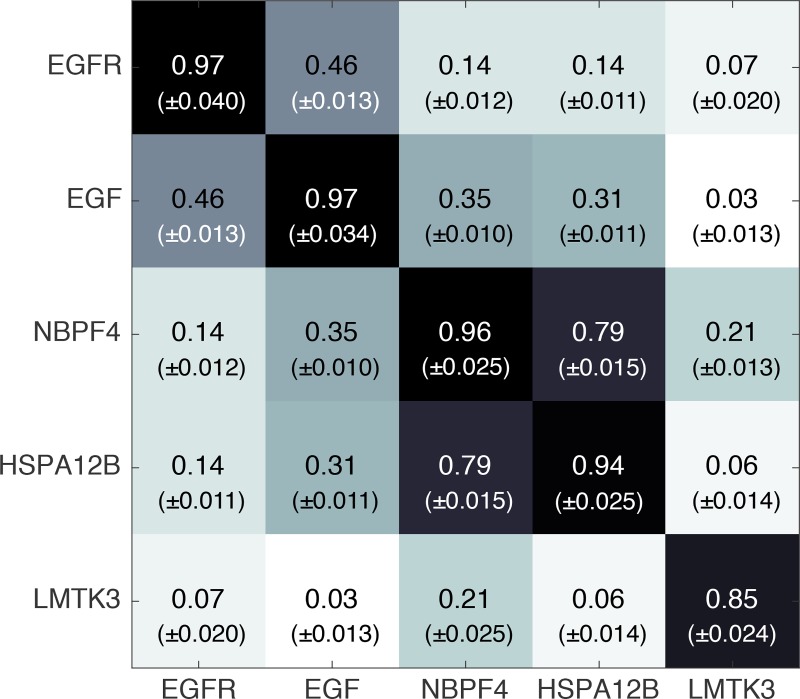
Fig 5. Pearson correlation among pairs of five simulated proteins photon traces.
The elements of the correlation matrix, consisting of all Pearson correlation coefficients between all pairs of 50 translocation repeats, were first transformed to Fisher’s z, subsequently averaged and finally transformed back into an “average” Pearson correlation coefficient [32]. The standard deviation is given in parentheses.

