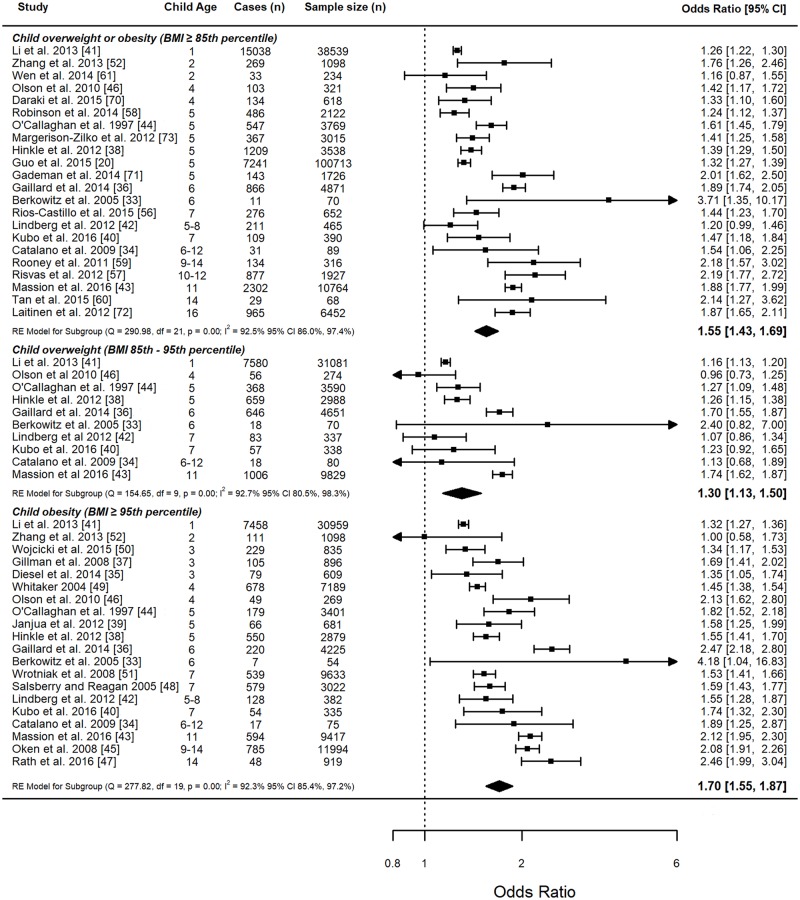
Fig 2. Linear meta-analysis of odds ratios and 95% confidence intervals for child weight status categories.
Meta-analysis by child weight status categories: child obesity (≥95th percentile), overweight or obesity (≥85th percentile), and overweight (85th–95th percentile). Pooled summary data for each child weight status category represent the odds ratio and 95% CI for each 5-kg/m2 increase in maternal BMI. The size of the data markers indicates the weight assigned to each study in the meta-analysis. Squares represent the odds ratio, bars represent the 95% confidence interval, and diamonds represent the pooled analysis for each child BMI category. RE, random effects.

