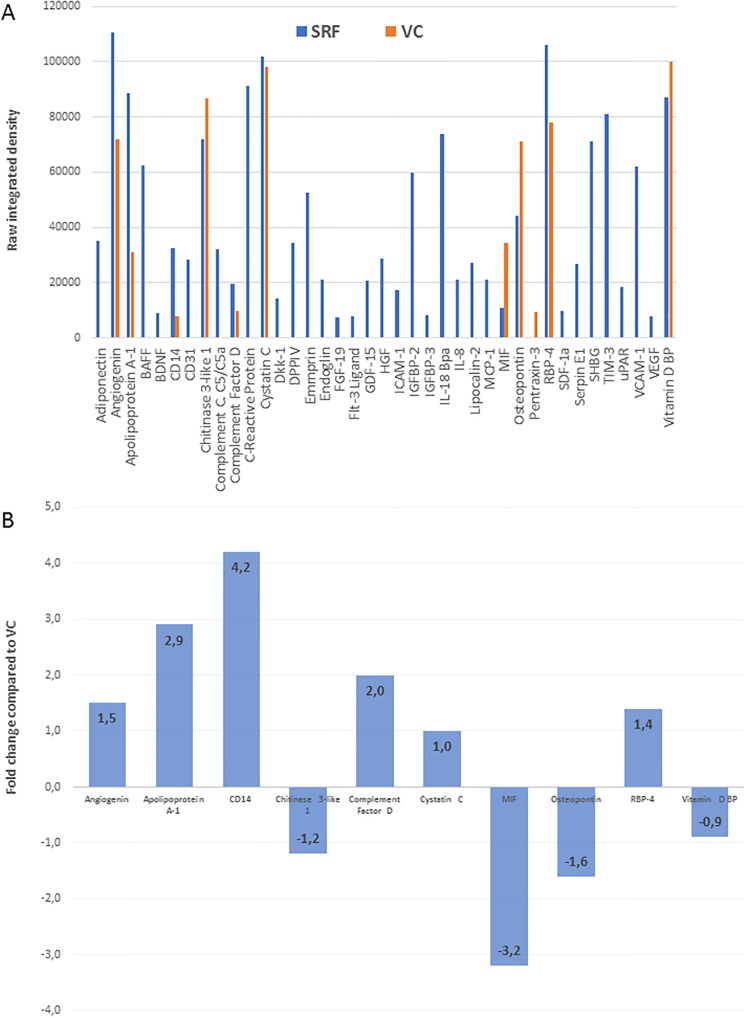
Fig 4. Semi-quantitative proteome profiler cytokine array.
Individual cytokines detected in SRF (blue bars) versus VC (orange bars) are plotted against pixel density values (y-axis) (A). The difference in the cytokines detected in both SRF and VC are represented (B) as the fold change difference in SRF compared to VC.

