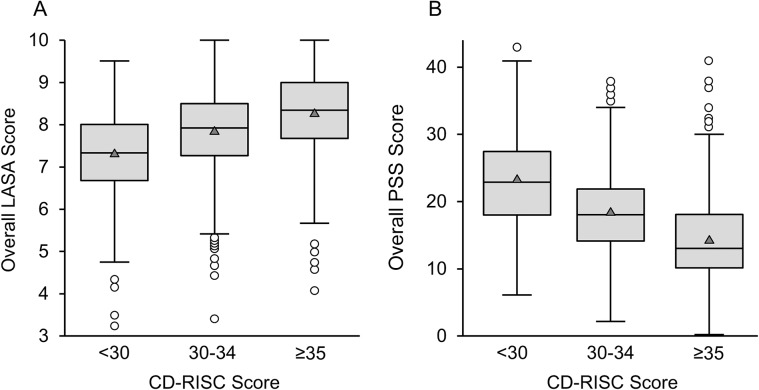
Fig 2. Box-and-Whisker Plots of LASA and PSS scores, Stratified by Resilience Levels.
Resilience groups were defined by the CD-RISC score. Lower resilience was defined as a score <30; medium resilience, 30–34; higher resilience, ≥35. Boxes show the median (middle horizontal line), interquartile range (25th percentile [Q1] and 75th percentile [Q3]: lower and upper edges of box), and range; the whiskers (dashed lines) extend from the outer edges of the box to the most extreme point within a distance equal to 1.5 × (Q3-Q1); any observations extending beyond that distance are shown as individual points in the figure. A, Overall LASA score (P < .001 for all pairwise comparisons). B, PSS Score (P < .001 for all pairwise comparisons). CD-RISC indicates Connor-Davidson Resilience Scale; LASA, Linear Analogue Self-Assessment; PSS, Perceived Stress Scale.

