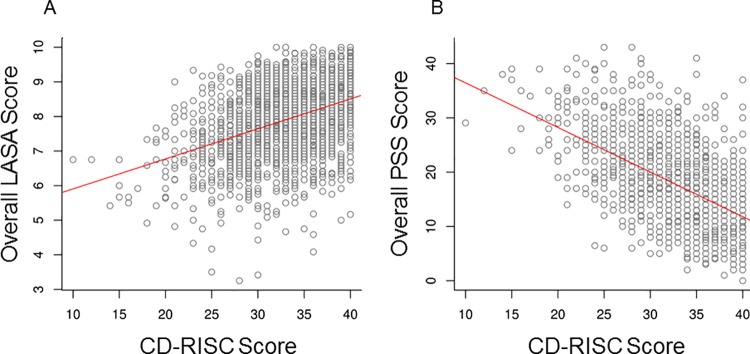
Fig 3. Scatterplots of association of LASA or PSS score With CD-RISC score.
The estimated linear regression line is shown in red. A, Overall LASA score (correlation between LASA and CD-RISC = 0.40). B, PSS Score (correlation between PSS and CD-RISC = −0.55). CD-RISC indicates Connor-Davidson Resilience Scale; LASA, Linear Analogue Self-Assessment; PSS, Perceived Stress Scale.

