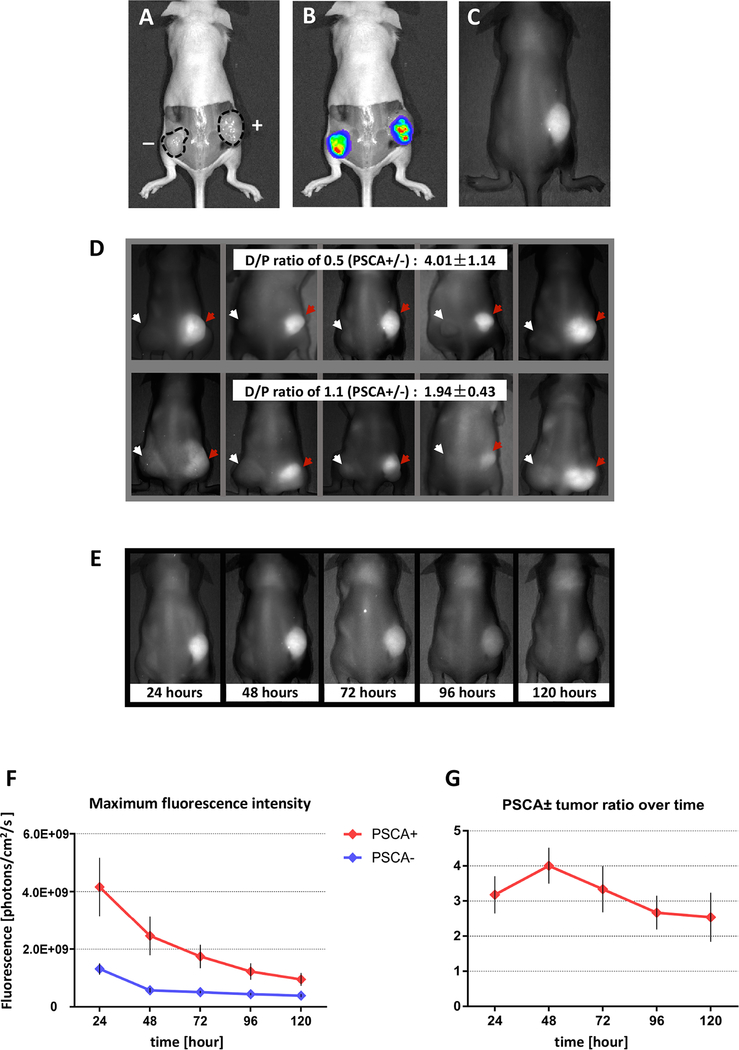
Figure 2.
Determination of the optimal imaging parameters for detection of PSCA expressing tumors in vivo using A11 Mb-IRDye800CW.
A-C, a representative mouse bearing 22Rv1-PSCA (right flank) and 22Rv1 (left flank). Tumors were imaged under white light (A), bioluminescence (B) and fluorescence (C). The contour of tumors is marked by the dashed line. Both 22Rv1-PSCA and 22Rv1 tumors showed bioluminescent signals due to luciferase expression. Fluorescent signals were detected by A11 Mb-IRDye800CW in the PSCA+ tumor. D, two different dye-to-protein ratios of A11 Mb-IRDye800CW probe intravenously administrated to tumor-bearing mice (22Rv1-PSCA, right flank. PSCA-negative 22Rv1, left flank) (5 mice per group). Fluorescence images were captured 48 hours post-injection. Red arrow, PSCA+ tumor. white arrow, PSCA- tumor. Mean of PSCA +/− tumor signal ratios is indicated. E–G, five mice bearing 22Rv1-PSCA (right flank) and PSCA-negative 22Rv1 (left flank) tumors received 25 μg of A11 Mb-IRDye800CW (D/P ratio: 0.5) intravenously and imaged at time indicated after probe injection. E, serial images of a representative mouse over time. F, average maximum fluorescence intensity of PSCA+ and PSCA- tumors over time after probe injection. G, the average ratios of the maximum fluorescence intensities of PSCA+ tumor compared to the PSCA- tumor from each mouse over time.

