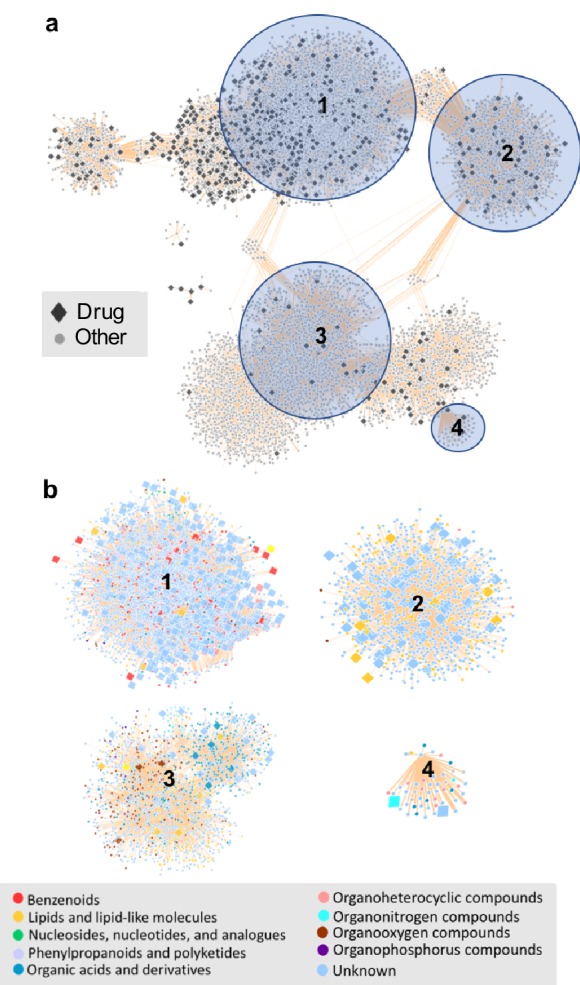
Figure 6. The chemical space of the gut microbiome.
(a) Chemical similarity network of food-derived or endogenous compounds (gray circles, "Other") and therapeutic drugs (black diamonds, "Drug"). Tan edges are weighted by substructure similarity where thicker edges indicate higher substructure similarity. The distribution of compounds in chemical similarity space illuminates regions of low and high chemical substructure overlap between drugs and other compounds. (b) Compounds from selected regions of the network are colored by their superclass level taxonomy based on the FooDB chemical structure classification (Wishart, 2012). Food-derived or endogenously produced compounds are identified with blue circles, therapeutic drugs with red diamonds. Within high-drug density, highlighted regions 1 and 2, drugs share substructure similarity with food-derived benzenoids, lipids, phenylpropanoids and polyketides. In the low-drug density highlighted region 3, drugs overlap with organonitrogen compounds and nucleosides. Region 4 includes organonitrogen compounds and nucleosides in addition to lipid-like molecules which have minimal overlap with therapeutic drugs.


