. 2019 May 7;8:e44898. doi: 10.7554/eLife.44898

Figure 1. Schematic for synchrotron X-ray micro-tomography of whole zebrafish.

Quasi-parallel X-rays from beamline 2-BM-B are used to acquire projection images of an intact, fixed, and PTA-stained whole zebrafish. Total imaging time is ~20 min per monochromatic acquisition (sample-to-scintillator distance = 30 mm) and ~20 s per pink-beam acquisition (sample-to-scintillator distance = 25 mm). Each fish requires 3 to 5 acquisitions. The top inset shows the relative sizes of a juvenile (left), a larva (right), and a dime (diameter = 17.9 mm). Fish are shown embedded in acrylic resin with the polyimide tubing removed. Removal of the polyimide tubing is necessary for natural color light photography, but not for successful X-ray image acquisition. Scale bars in the specimen insets are 1 mm.

Figure 1.

Figure 1—figure supplement 1. X-ray energy optimization for synchrotron micro-CT.

Figure 1—figure supplement 1.

X-ray energy was modeled for different sample sizes and metal concentrations. (Left) Analytic contrast-to-noise ratio (CNR) for tungsten contrast detail in water background assuming ρW= 0.06 g/cm3, dW = 0.36 mm, ρH20= 1.0 g/cm3 and dH20 varying from 1 to 5 mm. (Right) Analytic contrast-to-noise ratio for tungsten for contrast detail in water background assuming ρW varying from 0.01 to 0.2 g/cm3, dW = 0.36 mm, ρH20 = 1.0 g/cm3 and dH20 = 1 mm. The plots indicate that over a wide range of sample sizes and metal concentrations, an optimal energy range is ~12 to 16 keV.
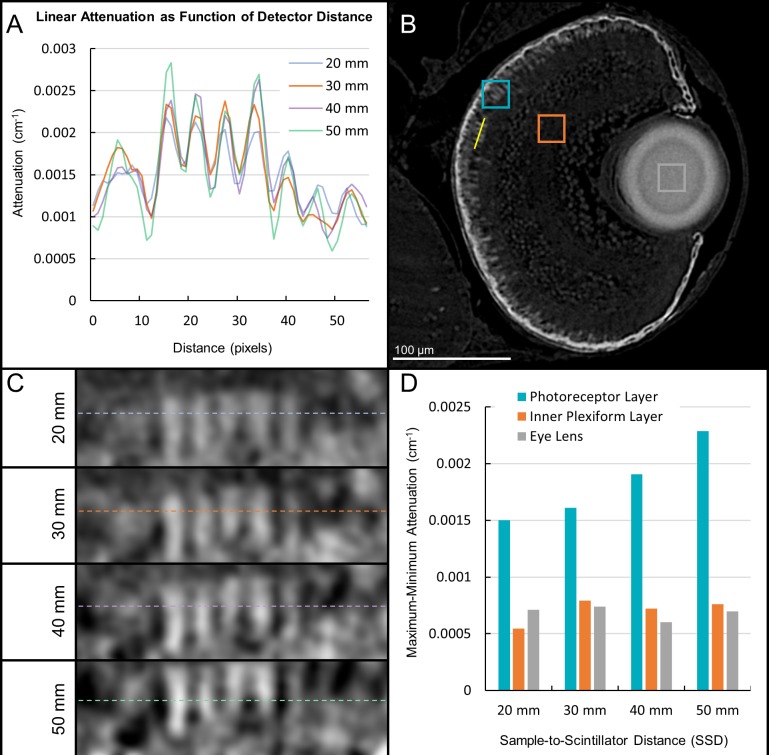
Figure 1—figure supplement 2. Sample-to-scintillator distance selection for synchrotron X-ray micro-tomography.

Figure 1—figure supplement 2.

A range of sample-to-scintillator distances (SSD) was surveyed for phase contrast enhancement of edges in larval samples. A line profile (A) is drawn through the retinal region as denoted by the yellow line in (B) to highlight differences in voxel intensity at edges. Zoomed insets (C) show the photoreceptor layer aligned with the attenuation profile in (A). The attenuation range (maximum attenuation– minimum attenuation) is shown in (D) for homogenous (lens, inner plexiform layer) and variable (photoreceptor layer) regions. The attenuation range increases for variable regions but remains constant for homogenous regions as SSD increases, demonstrating the effects of phase contrast edge enhancement. A SSD of 30 mm provided a level of edge perception resembling that found in traditional glass slide histology and was used for all subsequent acquisitions.
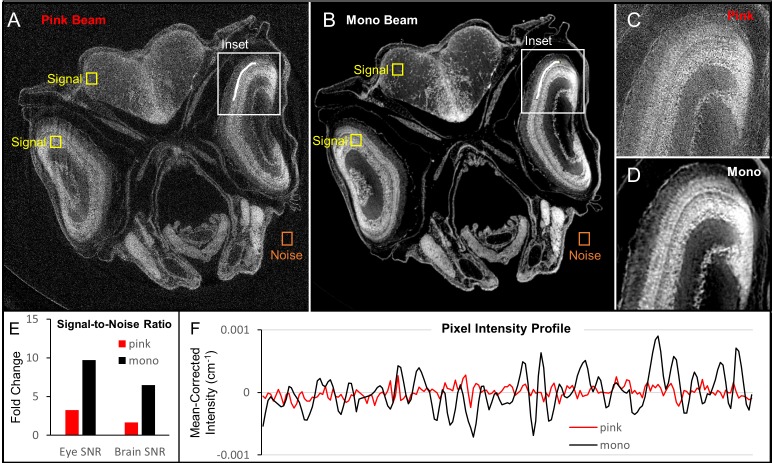
Figure 1—figure supplement 3. Comparison of image quality between monochromatic and polychromatic X-rays for synchrotron micro-CT.

Figure 1—figure supplement 3.

A juvenile (33 dpf) zebrafish was scanned using pink-beam (A) and monochromatic (B) sources. Insets show the ability for pink-beam (C) and monochromatic beam (D) to resolve the fine detail found in zebrafish photoreceptor layer. Signal-to-noise ratio (SNR) in high (eye lens) and low attenuation (brain) tissues was compared for both images (E). The monochromatic beam image has a higher SNR than the pink-beam image in both cases. While the noise in the pink beam image could be reduced by increasing acquisition times, the contrast in the monochromatic image is inherently better. A line profile (F) through the photoreceptor layer shows that the monochromatic beam is superior for discerning edges, which can be attributed to the phase contrast optimization done in Figure 1—figure supplement 1. Under these pink-beam imaging conditions, phase-contrast enhancement, which is energy-dependent, gets averaged out.