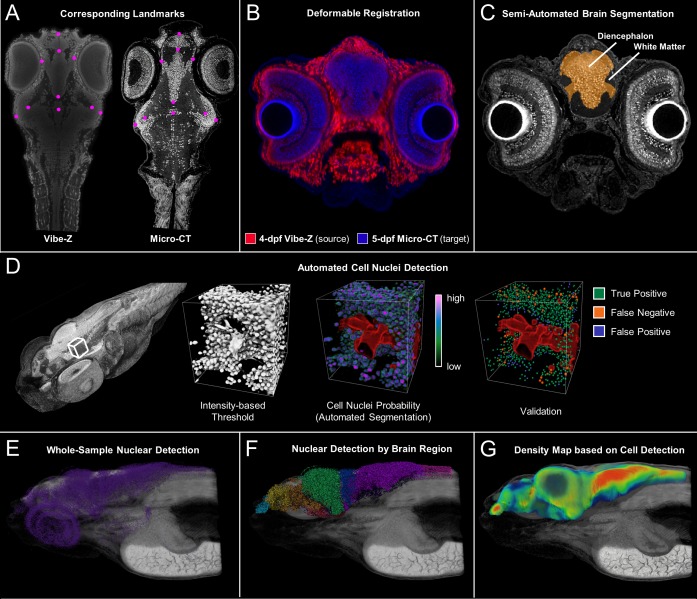
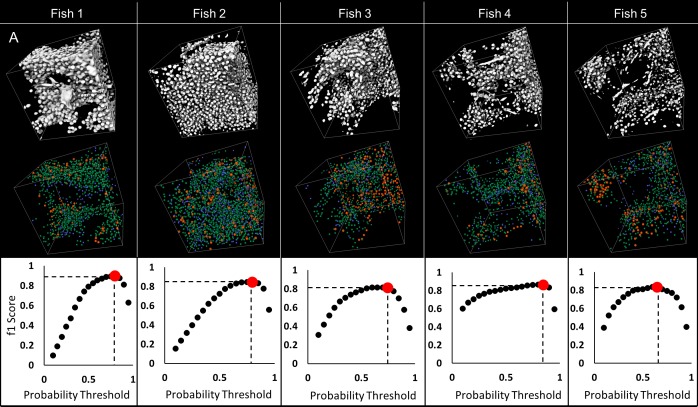
Figure 7. Cross-atlas registration and neuronal cell nuclei detection for assignment of automatically detected cells to major brain regions in developing zebrafish.
Developing larval (five dpf) zebrafish brains were divided into 10 quantifiable anatomically relevant regions by registering sample brains to the Vibe-Z volume-based zebrafish brain atlas and referencing to an immunohistochemistry BrdU based neuroanatomy atlas. Sample landmark selection is shown for equivalent slices between the ViBE-Z atlas data and a five dpf micro-CT for registration-based segmentation (A). Overlay of ViBE-Z atlas embryo (red) over five dpf data (blue) post-registration (B). Semi-automated brain segmentation presented for a five dpf sample in its anatomic context in a representative slice (C). Neuronal cell nuclei detection and validation using a supervised random forest classifier (D). Nuclear detection visualized as a point map for a typical five dpf sample in its anatomic context (E). Semi-automated brain segmentation overlaid onto classifier-based nuclei detection (F). Brain density was calculated by counting every nucleus within a ~ 22 micron (30 voxel) radius surrounding each voxel of the brain (G)..This dimension waschosen because it covers about 5 cell diameters, an estimate of the width of a small brain region.


