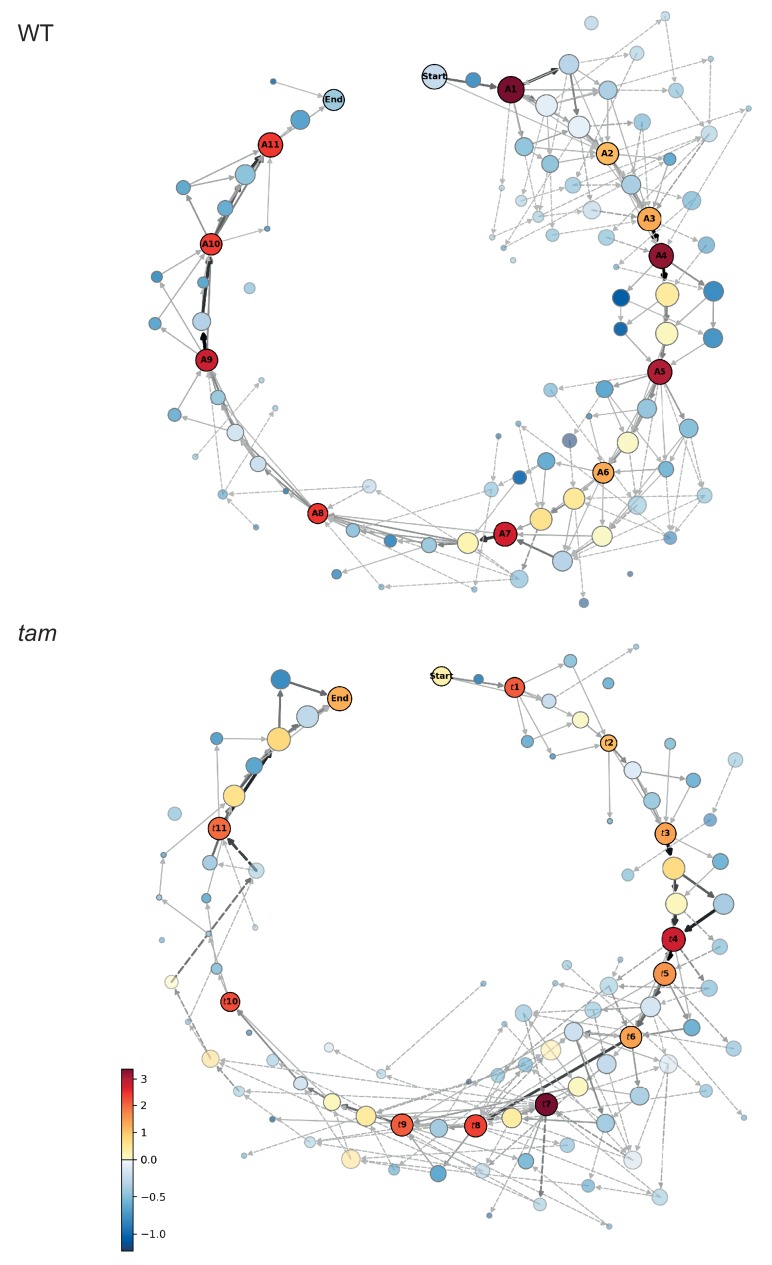
Figure 4. Matrix of cellular states.
The two schemes represent the matrix of the observed cellular states and how they relate to each other, in the WT (upper scheme) and tam background (lower scheme). Each circle represents a cellular state as a function of the combination of the observed parameters states. The area of the circle indicates the number of observations of that particular combination while the color indicates its neighboring score value; the warmer the color the higher is the neighboring value. The circles with a name and marked by a dark outline are the selected landmark states. The remaining circles are defined as transition states. The arrows represent all the direct transitions between cellular states observed within the data set, the thicker the arrows, the higher the number of observations. The dotted lines are transitions that do not fit the landmark scheme for example a trapezoidal cell (cell shape state 2) paired to an half moon initial state (MT array state number 3), yet with a centrally placed nucleus (state number 1). Most of these states are observed very rarely (2.8% in total).

