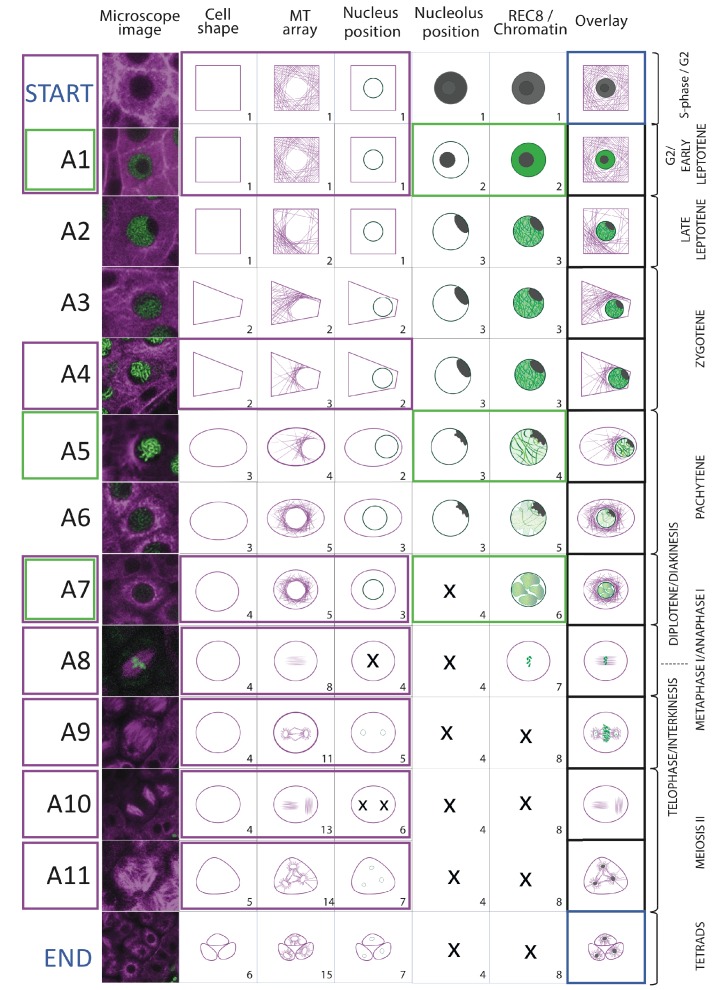
Figure 5. Landmark scheme Illustration of the 11 meiotic landmarks.
(A1-A11) identified by the neighboring score in WT male meiosis. The first column provides a microscopy picture of meiocytes depicting each cellular state. The state of each parameter is separately shown in the following columns, the right-most column (overlay) displays their combination. On the right side, the classical stages of meiosis are roughly assigned to each landmark. The magenta and green frames identify the landmarks obtained by the analysis of TagRFP:TUB4 and REC8 separately.

