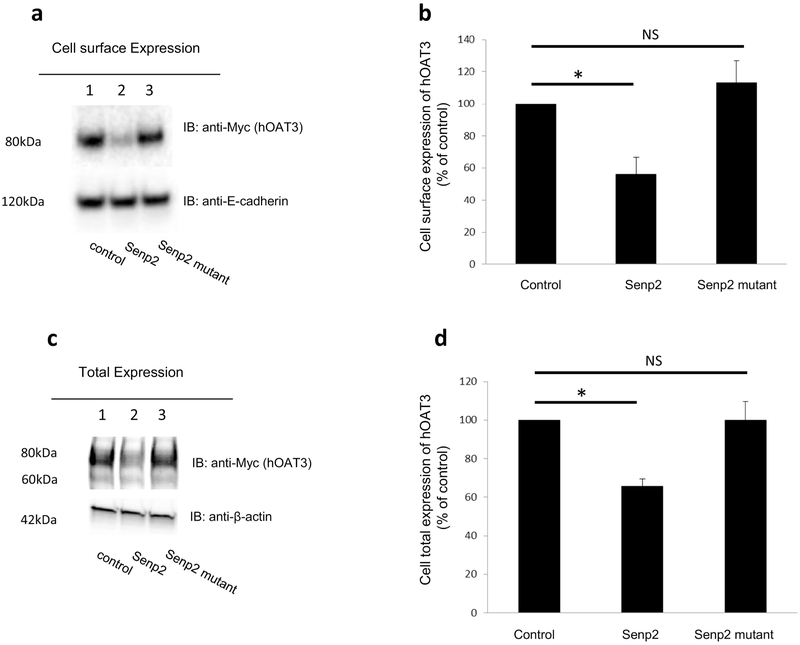
Fig. 5. Effect of Senp2 on hOAT3 expression.
(a). Cell surface expression of hOAT3. Top panel: hOAT3 together with control vector, Senp2 or the inactive mutant of Senp2 were cotransfected into COS-7 cells for 48h. Transfected cells were labeled with biotin. Biotinylated/cell surface proteins were separated with streptavidin beads, followed by immunoblotting (IB) with an anti-Myc antibody (epitope Myc was tagged to hOAT3 to facilitate the immunodetection). Bottom panel: The same blot as the top panel was re-probed with anti-E-cadherin antibody. E-cadherin is a cell membrane marker protein. (b). Densitometry plot of results from Fig. 5a, Top panel, as well as from other experiments. The values are mean ± SD. (n = 3). *P<0.05. NS: statistically not significant. (c). Total expression of hOAT3. hOAT3 together with control vector, Senp2 or the inactive mutant of Senp2 were co-transfected into COS-7 cells for 48h. Cells were lysed, followed by immunoblotting (IB) with an anti-Myc antibody. (d). Densitometry plot of results from Fig. 5c, top panel as well as from other experiments. The values are mean ± SD (n = 3). *P<0.05. NS: statistically not significant.

