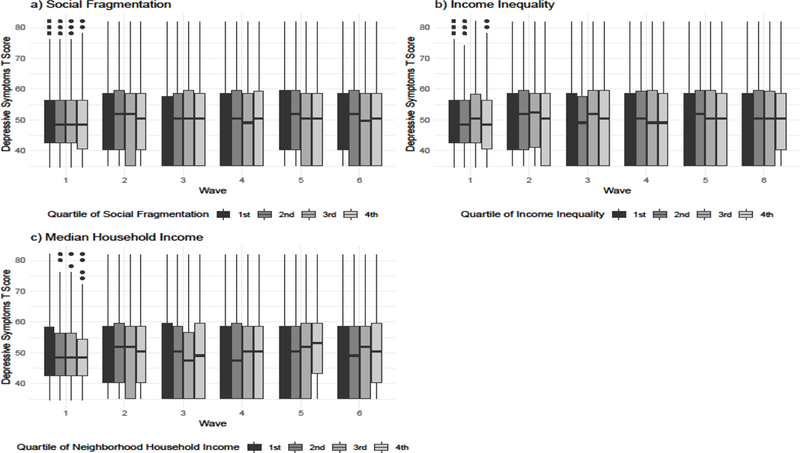
Figure 1. Depressive Symptom Scores at Waves 1–6 across Quartiles of Neighborhood Characteristics, NEXT Generation Health Study.

Boxplots of depressive symptoms are shown across waves 1–6 of the study for each quartile of neighborhood social fragmentation (panel a), income inequality (panel b), and median household income (panel c).
