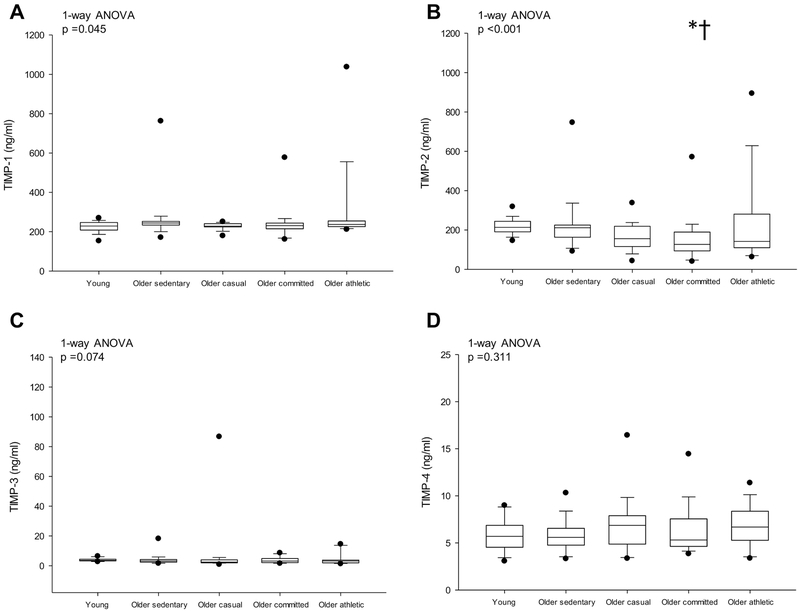
Figure 3.
Detected protein levels of TIMP-1 (A), TIMP-2 (B), TIMP-3 (C) and TIMP-4 (D).Box values are 25th and 75th percentile with error bars representing the 10th and 90th percentile. Filled black dots represent 5th and 95th percentile. *p <0.05 versus young sedentary; †p <0.05 versus older sedentary; ‡p <0.05 versus older casual. P-values derived from Kruskal-Wallis on ranks (1-way ANOVA) with Dunn’s post hoc test for between group comparisons.

