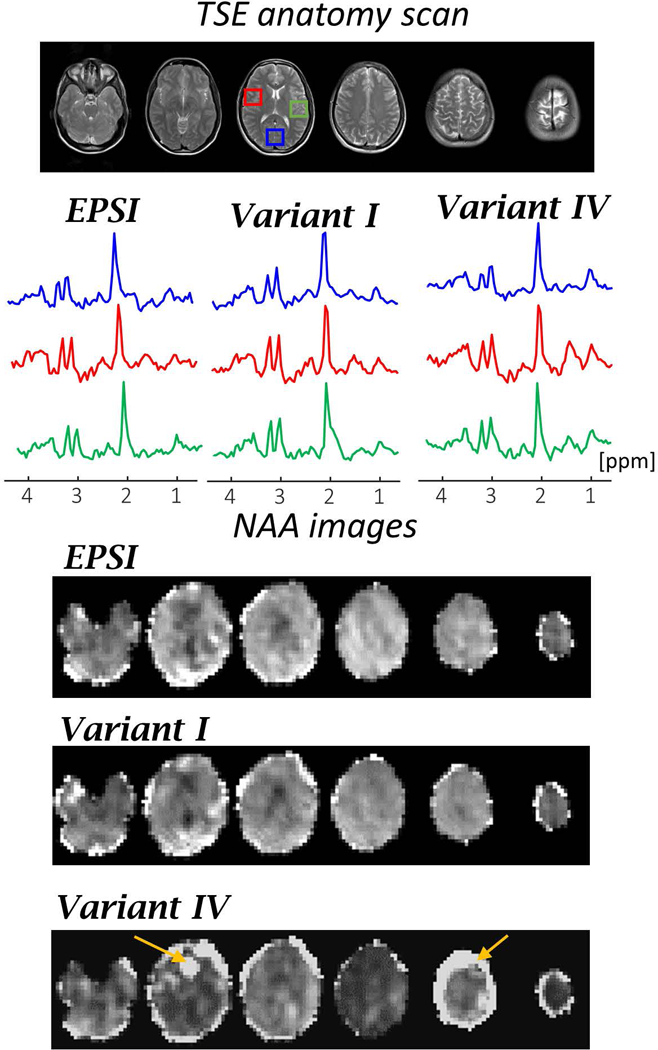
Figure 5:

In-vivo results of EPSI and variants I (with higher SW) and variant IV (with faster acquisition). From top to bottom: TSE anatomy images of the scanned slices; real spectra for each MRSI method at three regions (each averaging over 5×5 voxels) in the central slice (shown in red, blue and green rectangle overlays); and images of six slices for NAA using spectra integration in the range of 0.4 ppm. The image intensities of NAA is normalized to the NAA intensity in each of the methods.
