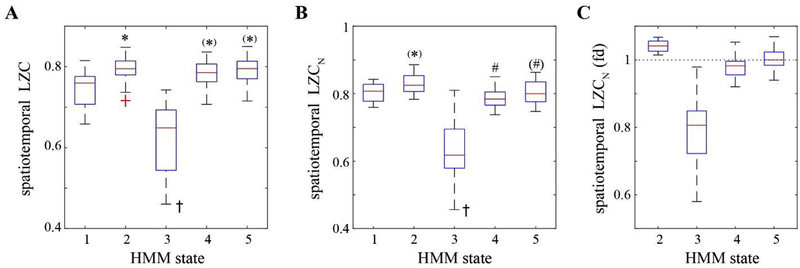
Fig. 4.
HMM state-specific complexity analysis. The complexity changes across the HMM states as assessed by spatiotemporal LZC (A) and its normalized measure, spatiotemporal LZCN (B, and C in the form of fold changes from the baseline-associated state S1). On each box, the central line and edges indicate the median and the interquartile range (IQR) of the values across the participants, the whiskers extend to the most extreme values, and the outliers are marked as red crosses. * indicates significant increase relative to S1, # indicates significant increase relative to S2, while y indicates significant decrease as compared to all the other states, using linear mixed model analysis (Bonferroni corrected p < 0.05, while (*) or (#) indicating uncorrected p < 0.05).

