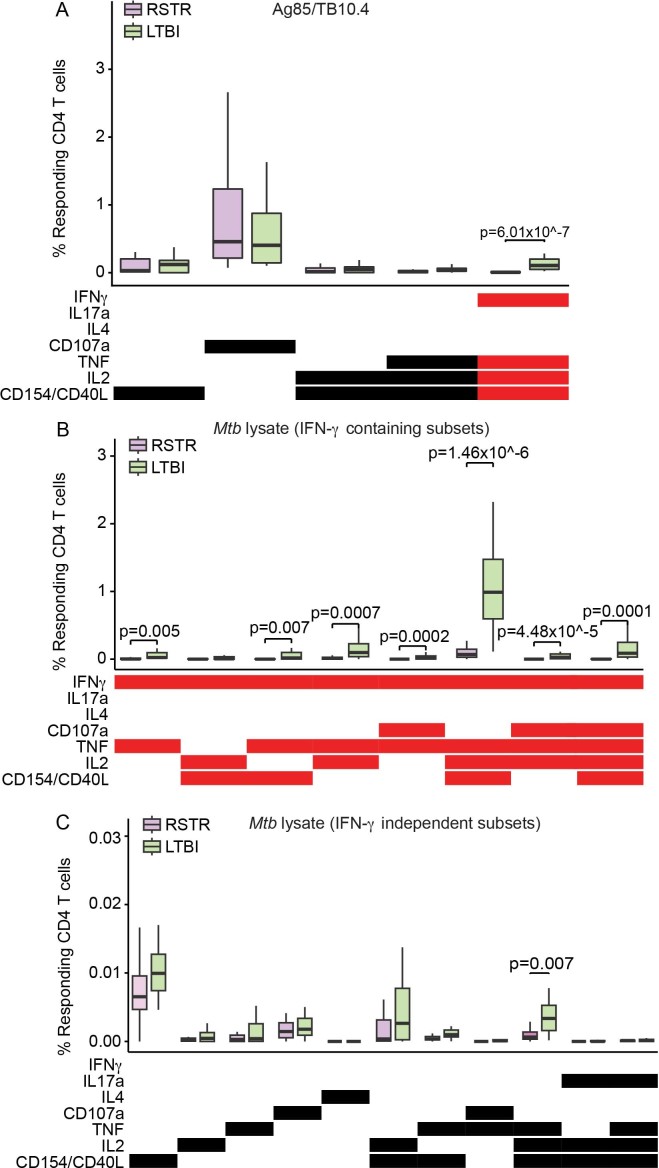
Extended Data Fig. 3. Frequencies of CD4 T cell functional subsets identified by COMPASS after stimulation with Ag85/TB10.4 and Mtb lysate.
a, Absolute magnitude after background correction of CD4 T cell functional subsets identified by COMPASS in Fig. 4a upon stimulation with Ag85/TB10.4 are shown for RSTRs (n = 22) and LTBI (n = 19). b,c, For CD4 T cell subsets identified by COMPASS after Mtb lysate stimulation in Fig. 4e, absolute magnitude after background correction is shown for IFN-γ-containing (b) or IFN-γ-independent (c) T cell subsets. Boxplots show median, 25th and 75th percentile of the distribution and whiskers depict the range without outliers. IFN-γ-containing subsets are noted in red. Statistical testing was performed on all the data points using Mann–Whitney U test with correction for multiple hypothesis testing using the Bonferroni method and two-tailed P values are shown.

