
Figure 3.
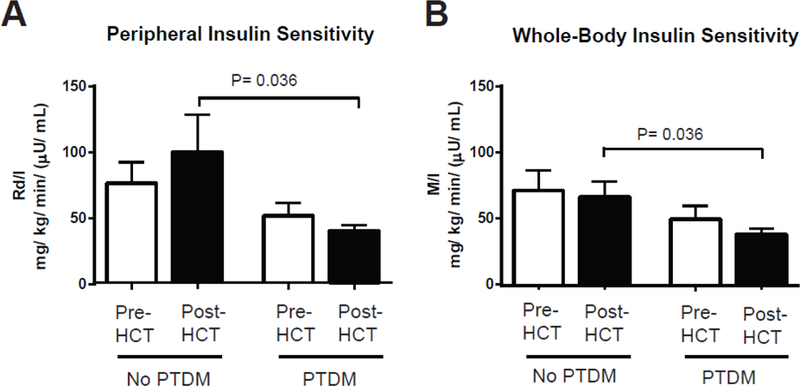
Insulin sensitivity before and 90 days after related, HLA-identical, peripheral blood hematopoietic cell transplant (HCT). Peripheral/skeletal muscle (Rd/I) and whole-body insulin sensitivity (M/I) were calculated during the euglycemic insulin clamp studies with high dose insulin infusion (80 mU/m2/min) (A and B, respectively). Decreased Rd/I and M/I values reflect worsening insulin resistance and decreased glucose disposal. Data expressed as mean ± SEM for n= 8 for pre-HCT measurements and n= 6 for post-HCT measurements in the “No PTDM” group and n= 11 for the “PTDM” cohort. Data were stratified for the development of new-onset post-transplant diabetes mellitus (PTDM). Independent and dependent groups were compared with a Mann-Whitney U test and Wilcoxon signed rank test, respectively.