Fig. 5.
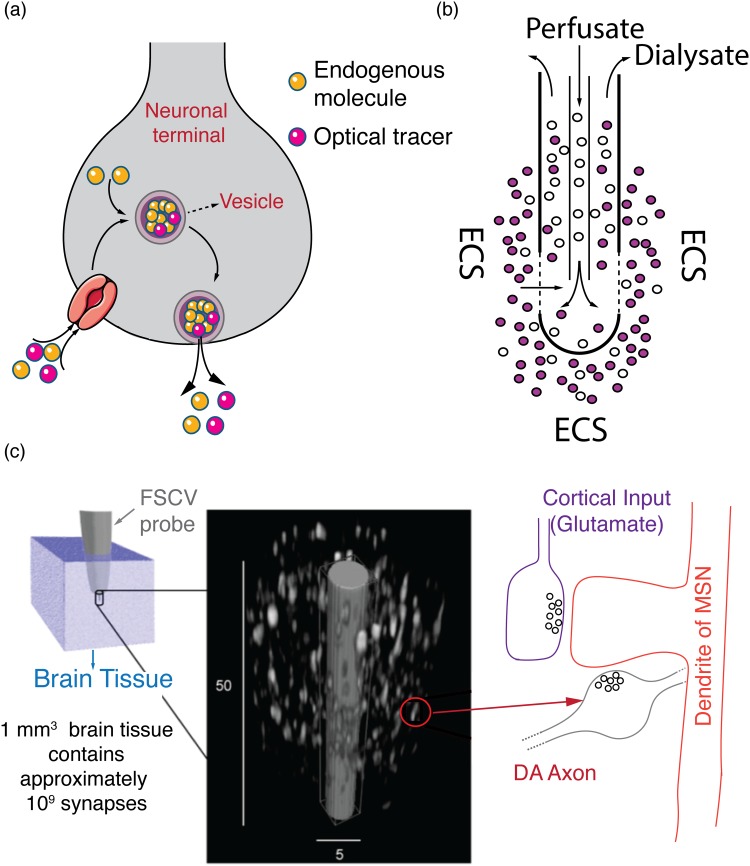
Fluorescent, analytical, and electrochemical methods for neurochemistry studies. (a) Schematic of FFN uptake and translocation into vesicles along with endogenous molecules. The FFN is fluorescent, enabling optical tracing of vesicular exocytosis with synaptic spatial resolution. The FFN (Optical Tracer) is internalized into the terminal along with endogenous dopamine molecules (Endogenous molecule). Inside the terminal, FFNs and dopamine molecules are cotranslocated into a vesicle, transported to the cell membrane and released into the ECS. (b) Schematic of a microdialysis probe. The blank perfusate typically contains no analyte of interest. Analytes diffuse across the semipermeable membrane and are recovered as dialysate for downstream analytical quantification. (c) Schematic of FSCV. The size of the FSCV probe (∼5 μm diameter) is shown relative to the size of dopaminergic terminals in the striatum. Left panel: a 1 mm3 brain tissue is estimated to contain up to 109 chemical synapses. Middle panel: a closeup of the tip of an FSCV probe (gray) is shown relative to the size of dopaminergic terminals (white) from which it is sampling. Only dopamine terminals are shown for clarity. Right panel: a representative dopaminergic terminal is shown on the right forming a synapse onto the dendritic spine of a medium spiny neuron. As is typical in the striatum, where FSCV probes are widely used, a glutamatergic terminal is also shown forming a synapse onto the same dendritic spine. (c) is reprinted with permission from D. Sames, M. Dunn, R. J. Karpowicz, and D. Sulzer, ACS Chem. Neurosci. 4, 648 (2013). Copyright 2013, American Chemical Society.

