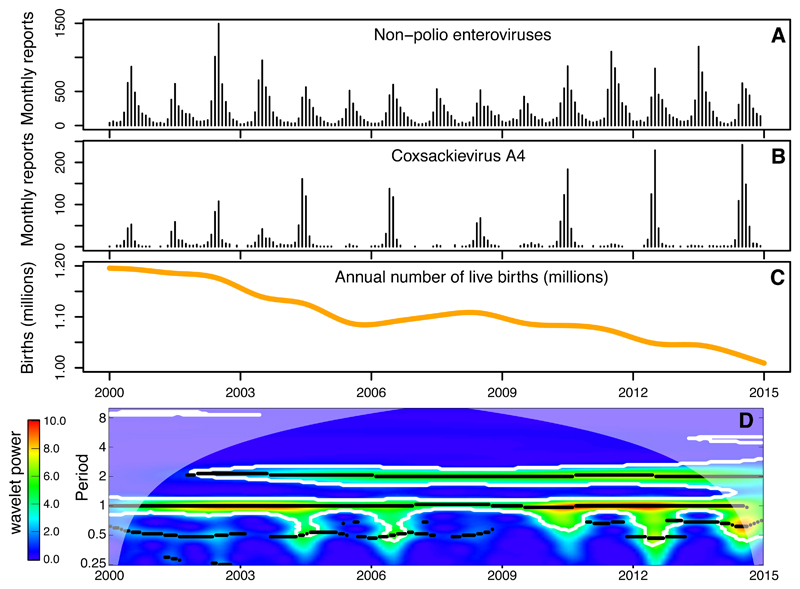
Fig. 1.
Non-polio enterovirus incidence and births in Japan (2000–2014). (A,B) Monthly number of reported enterovirus isolations from January 2000 to December 2014, for: (A) non-polio enteroviruses, and (B) CV-A4. (C) Smoothed annual number of live births. (D) Average wavelet power of the square-root–transformed time-series for CV-A4 showing the emergence of a biennial pattern of incidence.

