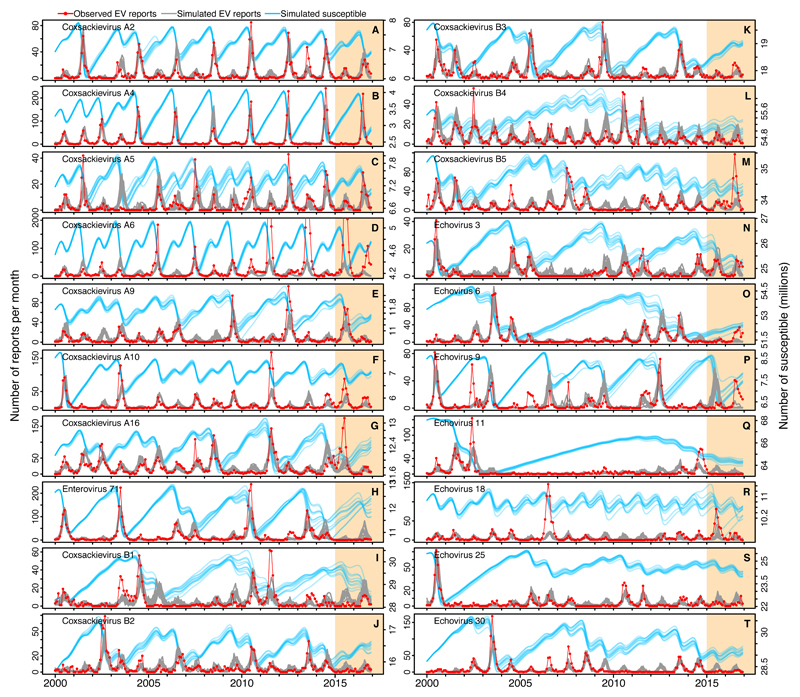
Fig. 2.
Model fit to data. The reported number of monthly isolations (red line) and 10 out of 100 stochastic simulations of the maximum likehood model (gray lines) with the closest match to the data are shown. The estimated number of susceptible individuals (blue lines) is shown in the right y-axis. Maximum likelihood parameter estimation and selection of simulations was based on data for January 2000 to December 2014 (white background), and projections continued out-of-sample for January 2015 to December 2016 (orange background). For CV-A6 and E18, parameter estimation was based on data through to December 2010 and December 2005 respectively, because of the poor fit of the model to the entire period. Parameter values in Table S2.

