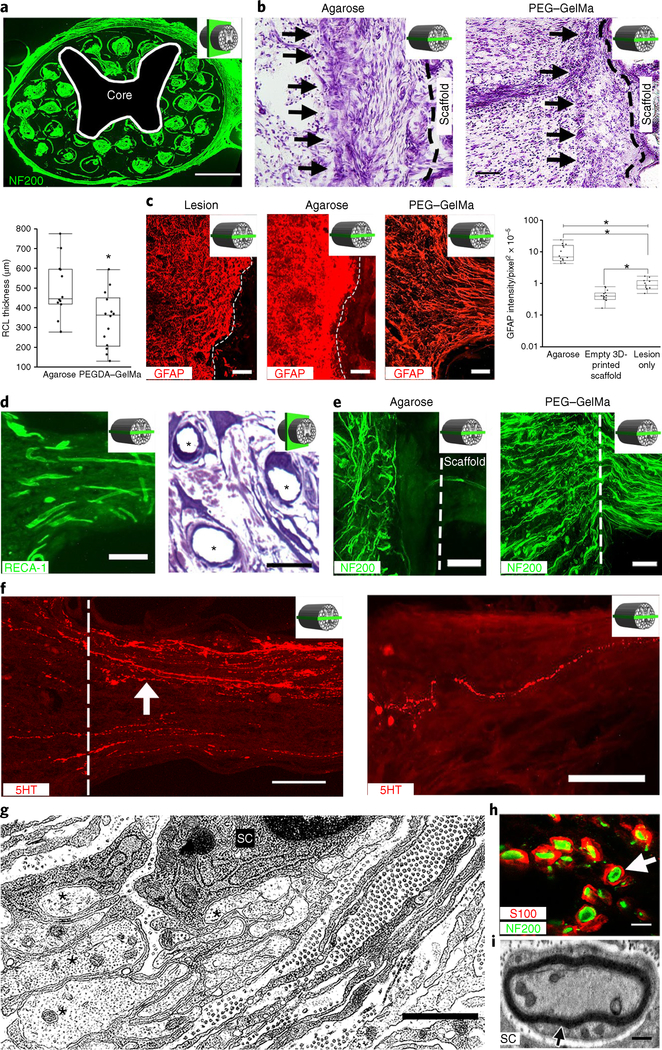
Fig. 2 |. Four weeks in vivo performance of empty 3D-printed scaffold implants.
a, A cross-section through an implanted scaffold labeled for axons (NF200). The inset schematic diagrams indicate the section orientation. b, Nissl stain reveals a reactive cell layer (arrows) at the site of implantation of an agarose scaffold (left) or a PEGDA-GelMa scaffold (right). Rostral is to the left and caudal is to the right. The black dashed line demarcates the interface of the host spinal cord with the scaffold. The box and whisker plot shows the quantification of the mean reactive cell layer (RCL) thickness. The boxes show the 25th-75th percentile range, and the center line is the median. Whiskers show 1.5 times the interquartile range (IQR) from the 25th or 75th percentile values. *P < 0.0019 (Student’s t-test), n = 12 animals. c, A host glial ‘scar’ is revealed by GFAP immunoreactivity in animals with lesion only (no scaffold) (left), an agarose scaffold (middle) or a 3D-printed scaffold (right). Rostral is to the left and caudal is to the right. In the 3D-printed scaffold, the glial processes align longitudinally with the channels. The box and whisker plot shows the quantification of the mean GFAP intensity in the host spinal cord surrounding the lesion site. The boxes show the 25th-75th percentile range, and the center mark is the median. Whiskers show 1.5 times IQR from the 25th or 75th percentile values. *P < 0.0001 (one-tailed ANOVA with post hoc Tukey’s), n = 11 animals. d, Scaffold vascularization shown by RECA-1 immunolabeling (left) and toluidine blue stain (asterisks indicate vessels) (right). e, Left, Host axons (labeled for NF200) do not enter agarose scaffolds. Right, Host axons enter 3D-printed scaffolds. The dashed line indicates the host/scaffold interface on the rostral end of the lesion site. f, Host 5HT-labeled serotonergic axons (white arrow) regenerate into an empty scaffold (left) and reach the caudal end of the channel (right). The white dashed line demarcates the rostral entrance to the channel. g, Electron microscopy within a channel demonstrates axons (asterisks) associated with a neighboring ensheathing Schwann cell (SC). h, A magnified view of a channel in a showing S100-labeled Schwann cells ensheathing NF200-labeled axons (arrow). i, Electron microscopy of a channel demonstrates a myelinated axon in the scaffold with a Schwann cell. Scale bars, 500 μm (a), 200 μm (b), 100 μm (c,e), 25 μm (d, left), 20 μm (d, right), 50 μm (f), 1 μm (g), 5 μm (h), 0.5 μm (i).

