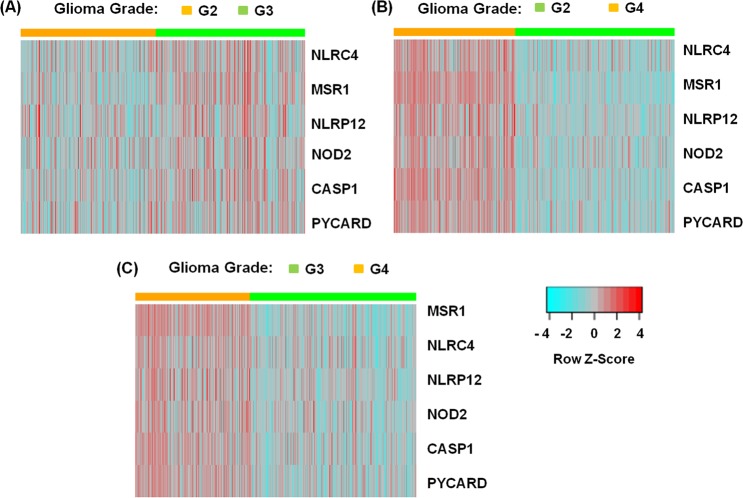
Figure 3.
Heat map clustering representation for most significantly differentially expressed NLR-associated genes in glioma. We have grouped all the glioma samples by glioma grade 2, 3 and 4. Here, G2, G3 and G4 represents grade 2, grade 3, and grade 4 respectively. (A) Shows gene expression of most differentially expressed genes, MSR1, NLRC4, NLRP12, NOD2, CASP1 and PYCARD across the grade 2 (orange) & grade 3 (green) of LGG samples. Similarly, panel (B,C) shows characteristic gene expression clusters between grade 4 (orange) & grade 2 (green) and grade 4 (orange) & grade 3 (green) glioma samples respectively. The segregation of grade 4 glioma from the grade 2 and grade 3 glioma is evident as the resulting heatmaps form expression ‘blocks’. Here, relative up-regulated and down-regulated gene expression, are shown in red and blue respectively.

