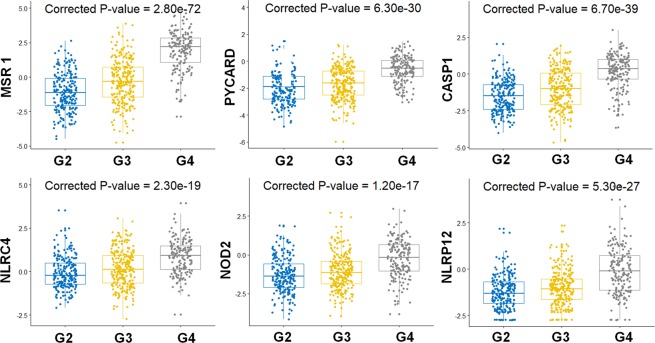
Figure 4.
Differential NLR gene expression in different grades of Glioma. The box plots show average gene expression values for differentially expressed genes, MSR1, CASP1, PYCARD, NLRC4, NOD2 and NLRP12 in LGG – grade 2 & grade and GBM- grade 4 glioma. Here, G2, G3 and G4 represents grade 2, grade 3, and grade 4 respectively. We conducted one-way ANOVA followed by posthoc tests using Bonferroni method, to calculate the corrected P-values for the differentially expressed genes in different grades of glioma.

