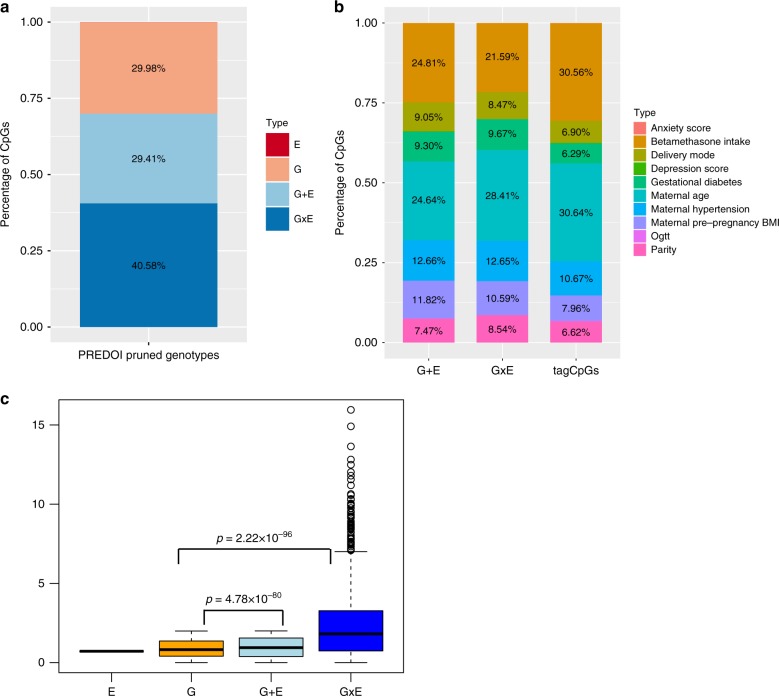
Fig. 2.
VMR analysis in pruned PREDO I dataset. a Percentage of models (G, E, GxE or G + E) with the lowest AIC explaining variable DNA methylation using the PREDO I dataset with pruned SNPs. b Distribution of the different types of prenatal environment included in the E model with the lowest AIC (right), in the combinations yielding the best model GxE (middle), or the best model G + E models (left). To increase readability all counts <3% have been omitted. c DeltaAIC, i.e, the difference in AIC, between best model and next best model, stratified by the best model. Y-axis denotes the delta AIC and the X-axis the different models. The median is depicted by a black line, the rectangle spans the first quartile to the third quartile, whiskers above and below the box show the location of minimum and maximum beta-values. P-values are based on Wilcoxon-tests

