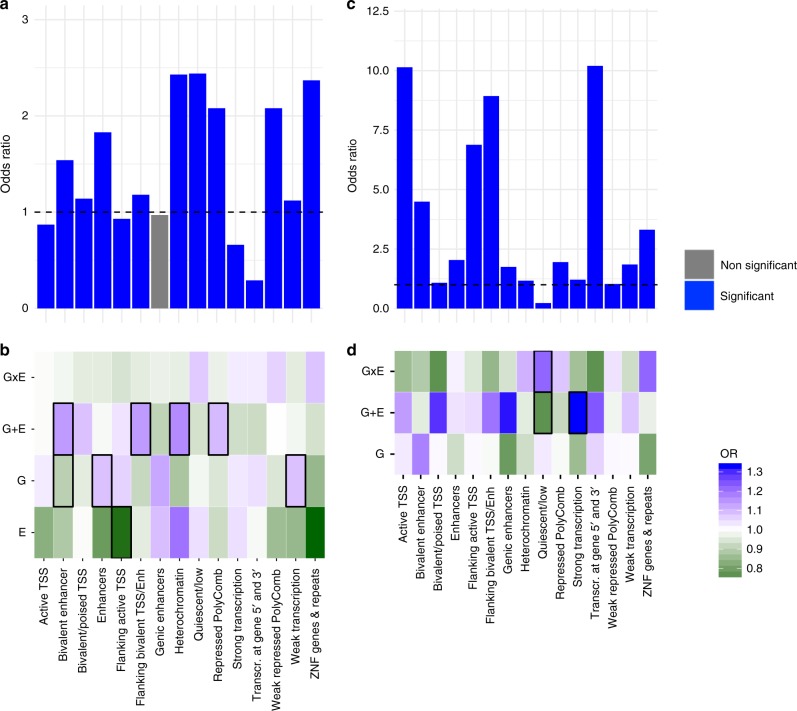
Fig. 4.
Functional annotation of VMR-mapping in DeepSEA annotated SNPs in PREDO I dataset. a Histone mark enrichment for all VMRs. The Y-axis denotes the fold enrichment/depletion as compared to no-VMRs. Blue bars indicate significant enrichment/depletion, grey bars non-significant differences based on Fisher-tests. b Histone mark enrichment for tagVMRs with best model E, G, G + E and GxE relative to all VMRs. Green colour indicates depletion, red colour indicates enrichment. Thick black lines around the rectangles indicate significant enrichment/depletion based on Fisher-tests. c Histone mark enrichment for all DeepSEA variants in the dataset. Blue bars indicate significant enrichment/depletion based on Fisher-tests. d Histone mark enrichment for all DeepSEA variants involved in models where either G, G + E or GxE is the best model as compared to all tested DeepSEA variants. Green colour indicates depletion, red colour indicates enrichment. Thick black lines around the rectangles indicate significant enrichment/depletion based on Fisher-tests

