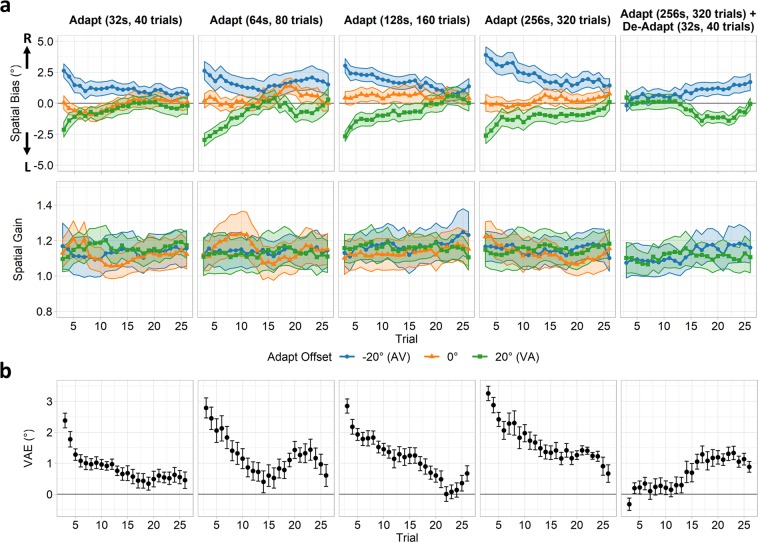
Figure 3.
Results of mixed-effects linear regression analyses for Experiment 2, plotted over trials and differing durations of adaptation. Data were analysed using a sliding-window (7 trials, incremented in 1 trial steps); values are plotted against the middle trial of each window. (a) Spatial bias (intercept) and spatial gain (slope) coefficients are shown on the top and bottom rows respectively, following adaptation to audio-visual pairs spatially offset by −20° (blue; audio left of visual), 0° (orange), or 20° (green; audio right of visual). Shaded ribbons indicate standard errors of the regression coefficients. (b) VAE magnitudes, defined as the trial-wise average of −20° > 0° and 0° > 20° adaptation offset contrasts of the spatial bias coefficients. Error bars indicate the standard error of the mean across subjects.

