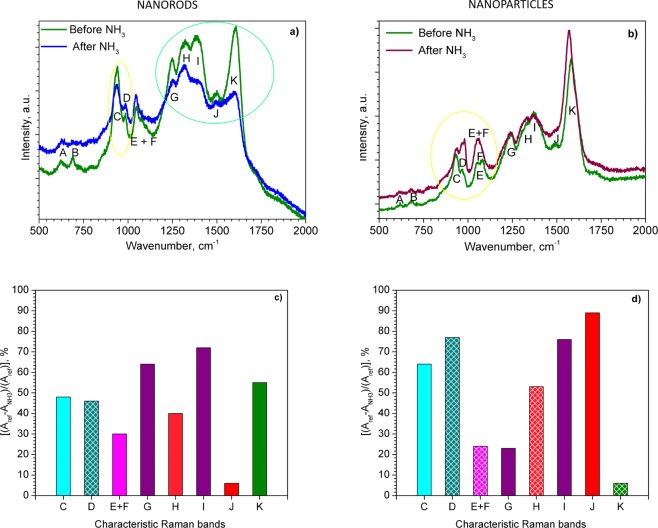
Figure 5.
Raman spectra of the PPy NRs (a) and PPy NPs (b) before (green line) and after the exposure to ammonia (blue and brown line); Relative changes of each Raman band area [(Aref − ANH3)/(Aref)] for the PPy NRs (c) and PPy NPs (d) after ammonia exposure. The area of the corresponding band (i.e., C, D, E, etc.) before and after ammonia exposure is expressed by Aref and ANH3, respectively. The patterned columns represent an increase in peak area after ammonia exposure, whereas the full color columns represent a decrease.

