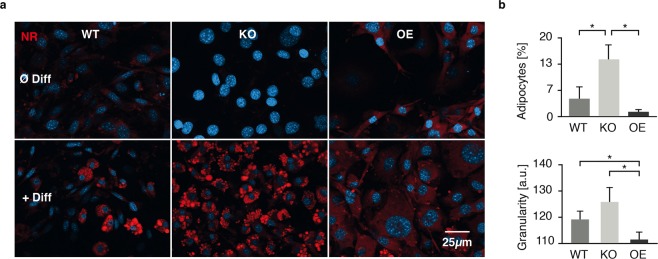
Figure 3.
Involvement of CAPSL in adipogenesis. (a) 3 T3-L1 pre-adipocyte differentiation capability was analyzed in Capsl deficient (KO) and overexpressing (OE) cells via Nile Red (NR) staining and fluorescence microscopy. Increased NR positive lipid droplet formation was observed in KO cells compared with wild type (WT) cells, while OE cells showed an increased reddish background signal but formation of only few distinct lipid droplets in three independent experiments (n = 3). (b) To quantify the observed differences in adipocyte differentiation from fluorescence microscopy experiments, 3T3-L1 WT as well as OE and KO cells were analyzed using FACS. Size (FSC 0.9–2,5 × 10⁵) and granularity (preadipocytes: SSC 0.4–1 × 10⁵, adipocytes: 0.6–2.5 × 10⁵) were used to determine the fractions of 3T3-L1 populations and their lipid content within each sample. FACS measurements of the adipocyte population compared with total population (cells with increased granularity) for each cell line is shown in the upper graph. Adipocyte granularity is plotted in the lower graph. Experiments were repeated three times (mean ± SD) and analyzed by student’s t-test (*p < 0.05).

