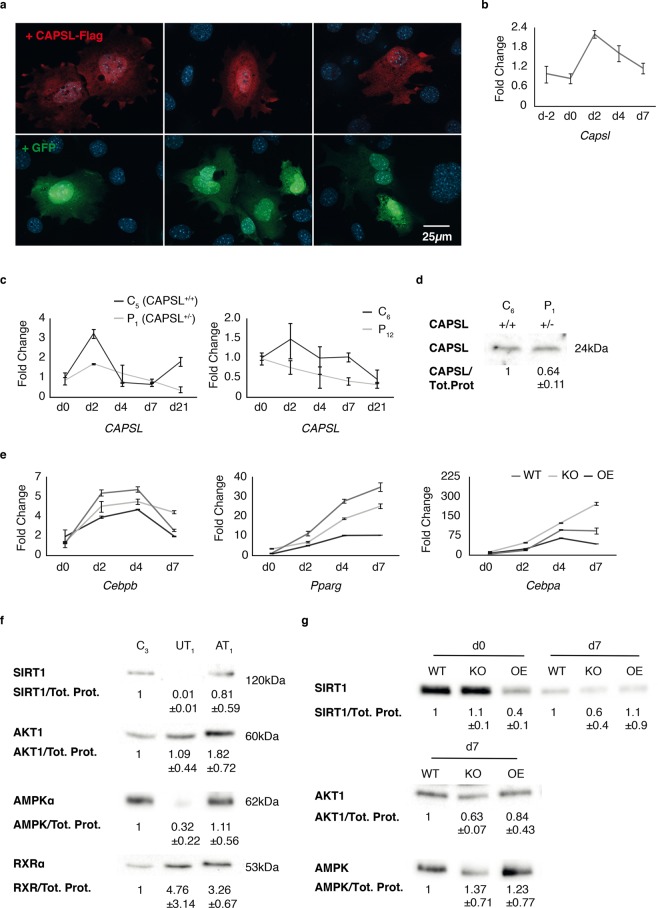
Figure 4.
CAPSL expression and influence on genes involved in adipocyte differentiation and metabolism in 3T3-L1cells. (a) 3T3-L1 wild type (WT) cell were transiently transfected with a CAPSL-Flag construct. CAPSL protein distribution was visualized using α-Flag and α-rabbit secondary antibody (red, upper panel). The obtained signal was distributed diffusely in the cell without obvious subcellular predominance. Cells transiently transfected with a GFP expressing vector showed similar distribution (lower panel). (b) Murine WT pre-adipocytes were differentiated and RNA samples from different days were measured via qPCR. Three independent experiments were performed and representative graphs are shown. (c) CAPSL gene expression was measured via qPCR in hASCs of 2 healthy controls (C2 and C3), and in CAPSL+/− (P1) adipocytes as well as in an independent MSL patient (P2). (d) CAPSL protein levels in CAPSL+/+ (control cells: C3) and CAPSL+/− (index patient P1) adipocytes were examined using western blots (n = 2, mean ± SD). (e) 3T3-L1 WT, Capsl knockout (KO) and Capsl overexpressing (OE) cells were examined at day 0, 2, 4 and 7 of adipogenic differentiation. Histograms represent qPCR measurements of Cebpb, Pparg and Cebpa. (f) Expression of SIRT1, AKT1, AMPK and RXR was detected using western blot. Cells extracted from unaffected (UT) and affected (AT) MSL tissue from the index patient (CAPSL+/−) and control cells (C3) were examined. Representative bands are shown and quantification based on three independent experiments and total protein normalization was performed (mean ± SD). (g) 3T3-L1 undifferentiated preadipocytes (d0) and mature adipocytes (d7) were analyzed on western blots. The following protein amounts were examined in WT, KO and OE cells: SIRT1, AKT1 and AMPK. Quantification of intensity levels of three independent experiments and normalization relative to total protein (Tot. Prot) levels as well as SD values (mean ± SD) are shown below each representative protein band.

