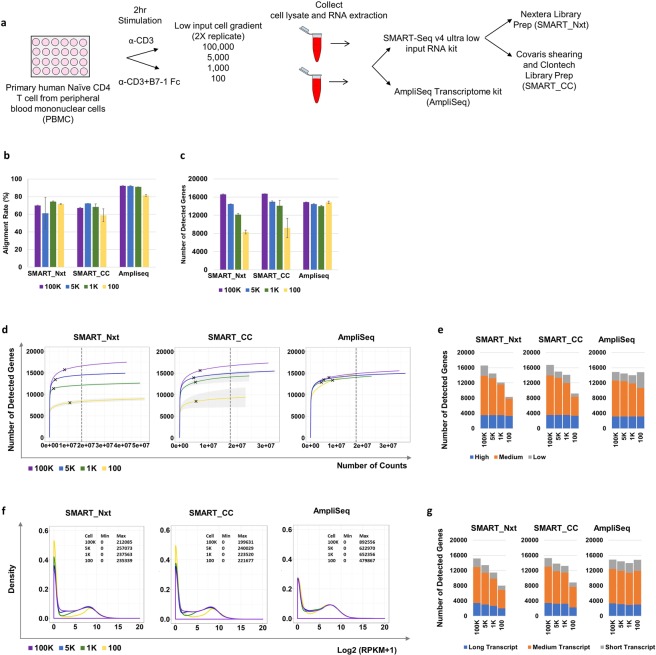
Figure 1.
Number of detected genes decreased with reduced input in SMART technology, while it remained constant for AmpliSeq technology. (a) Experiment design for low-input RNA-Sequencing platform evaluation using stimulated primary human naïve CD4 T cells. Three protocols based on two technologies and four cell gradients were tested. (b) Alignment rates for samples at the four input cell gradients (100, 1 K, 5 K, 100 K) for the three protocols. Bar plot shows mean +/− standard deviation of the replicates. (c) Number of USCS genes detected (count > 0) for samples at the four input cell gradients (100, 1 K, 5 K, 100 K) for the three protocols. Bar plot shows mean +/− standard deviation of the replicates. (d) Collection curves showing the number of detected genes at different sequencing depths in SMART_Nxt (left), SMART_CC (middle), AmpliSeq (right). Solid lines indicate the mean and shading regions indicate standard deviation. Black crosses in each sample indicates the sequencing depth where 90% of the genes were detected. Vertical dashed black lines indicate sampled library size for downstream analysis. (e) Number of detected genes grouped into high, medium and low expressing genes. (f) Density plot showing the distribution of the log2 transformed RPKM values in each cell input in SMART_Nxt (left), SMART_CC (middle), AmpliSeq (right). Minimum and maximum RPKM values at each cell input were also listed on the upper right of the plot. (g) Number of detected genes grouped into short, medium and long transcripts. Samples from α-CD3+ B7-1 Fc treatment were used for all figures.

